OTel Scaler Integrations
This guide walks through multiple ways to integrate your workloads with Kedify OTel Scaler. Depending on your observability maturity, performance requirements, and operational constraints, you can choose between a minimal setup with no collector, reusing an existing OpenTelemetry Collector, or deploying Kedify’s managed collector.
Each approach comes with different trade-offs in terms of reaction time, configuration complexity, and operational overhead.
As an example workload for scaling we choose to use a Spring Boot application, however Kedify OTel Scaler is not opinionated about the language or application frameworks. Given it can expose the metrics, it should work. What’s also nice is the fact that you can use the same set of environment variables across multiple languages or application frameworks, since the OpenTelemetry standard has proliferated across the ecosystem.
Integration Overview
Section titled “Integration Overview”At a high level, Kedify OTel Scaler communicates with KEDA over gRPC and consumes metrics over OTLP. These metrics ultimately drive autoscaling decisions for your workloads.
Depending on the integration method, metrics may be:
- pushed directly from the application
- routed through an existing OpenTelemetry Collector
- scraped or forwarded by a Kedify-managed collector
Option 1: No Collector
Section titled “Option 1: No Collector”This is the most lightweight integration option. Applications emit metrics directly to Kedify OTel Scaler using OTLP, without any intermediate collector.
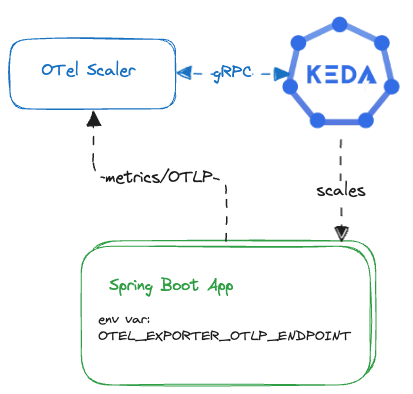
How it works
Section titled “How it works”The application is configured to push metrics directly to the OTel Scaler by setting the appropriate OTLP exporter endpoint. KEDA then queries the scaler to make autoscaling decisions.
Pros
- Push-based model enables fast reaction times
- Minimal infrastructure footprint
- No collector deployment required
Cons
- Requires changing environment variables for all applications that participate in scaling
- Each replica must expose a stable identity
- Identity must be propagated as a metric label (for example:
pod=foo-app_xha4s). This is required to be able to perform sum/avg or any other aggregation operation over the multiple metrics coming from multiple replicas.
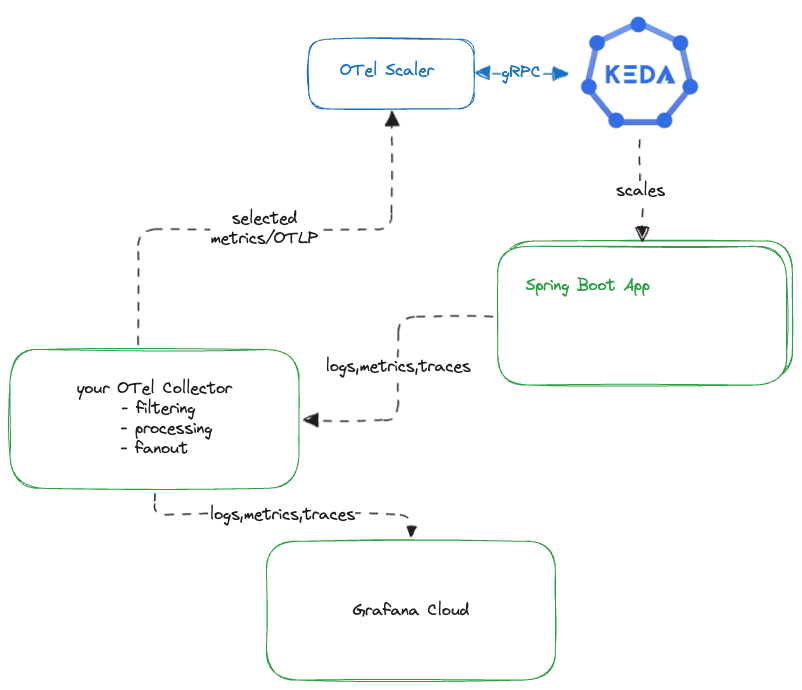
Option 2: Bring Your Own Collector
Section titled “Option 2: Bring Your Own Collector”How it works
Section titled “How it works”Kedify OTel Scaler implements the OTLP receiver contract, allowing it to be added as an otlp exporter’s target in any existing collector configuration. Metrics that participate in autoscaling are duplicated and forwarded to the scaler, while the rest continue through your existing observability pipelines.
Pros
- Reuses your existing OpenTelemetry deployment
- No changes required in the application instrumentation
- Seamless integration using standard OTLP exporters
Cons
- Requires additional collector configuration
- Collector must define multiple pipelines:
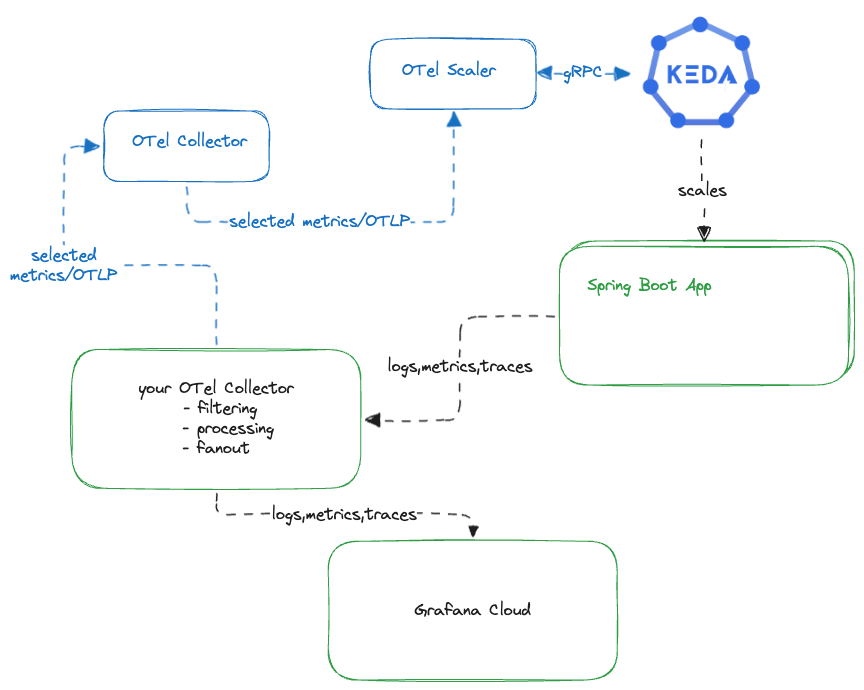
Option 3: Use Kedify OTel Collector
Section titled “Option 3: Use Kedify OTel Collector”This option deploys a Kedify-managed OpenTelemetry Collector alongside OTel Scaler. It supports both push-based and pull-based metric collection models.
Supported collection modes:
-
Push-based: OTLP metrics for selected signals only (logs and traces are ignored)
-
Pull-based: periodic scraping of
/metricsendpoint
Option 3a: Push-Based (OTLP)
Section titled “Option 3a: Push-Based (OTLP)”Description
Section titled “Description”Your existing OpenTelemetry Collector acts as a router. It forwards selected metrics—such as HTTP request counts or queue depth-to the Kedify collector, which then sends them to the gRPC receiver implemented in the OTel Scaler.
This approach is conceptually similar to Bring Your Own Collector, but Kedify manages the downstream collector and scaler components. Also scaler and collector can be installed and configured by one Helm chart.
Pros
- Single Helm chart deploys all Kedify-managed components
- Faster reaction times due to push-based delivery
- Clear separation of concerns between scaling metrics and general observability
Cons
- Requires a small configuration change in your existing collector
- Metrics must be explicitly routed to the Kedify collector
Setup Example
Section titled “Setup Example”A complete demo using k3d cluster is available in Kedify examples repo.
Assuming you have k3d, kubectl and helm CLIs installed; just clone the repo and run the script.
The demo sets up also Grafana and cert-manager.
Option 3b: Pull-Based (Scraping)
Section titled “Option 3b: Pull-Based (Scraping)”Description
Section titled “Description”This scenario uses the Prometheus receiver of the upstream OpenTelemetry Collector. The collector periodically scrapes metrics from pods that expose Prometheus-compatible endpoints.
For Spring Boot applications, this typically means enabling the /actuator/prometheus endpoint and annotating pods accordingly. For other application frameworks the metrics endpoint can differ. Yet another option here is to use target allocator and Prometheus CRDs. For this approach consult the migrate how-to guide.
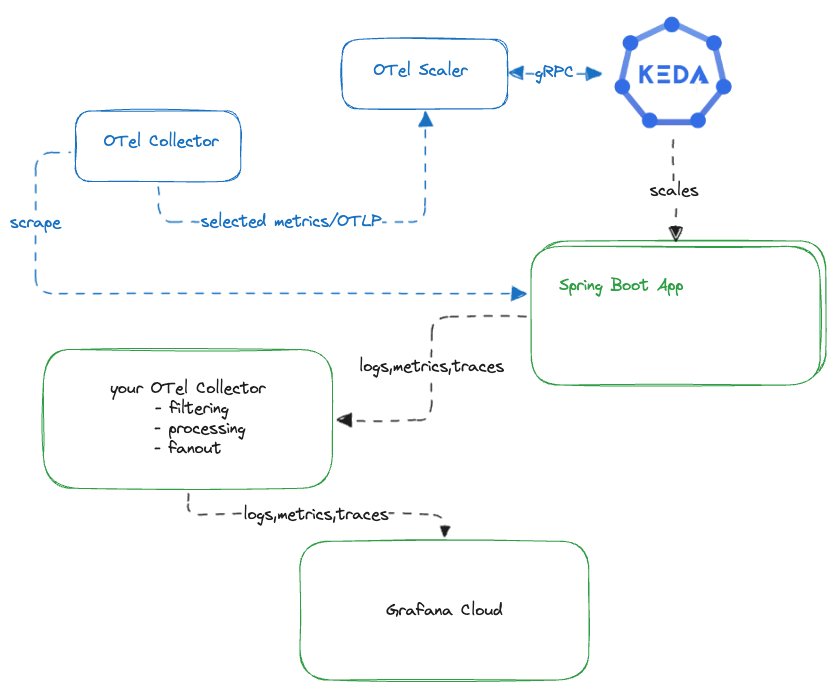
This model works well when push-based instrumentation is not feasible or when Prometheus-style scraping is already in use.
Setup Example
Section titled “Setup Example”A complete demo of this pull-based approach in Kedify examples repo.
Next Steps
Section titled “Next Steps”This guide outlined three different ways to integrate your applications with Kedify OTel Scaler, ranging from a minimal setup with no collector to a fully managed collector pipeline.
Each approach is suitable for different environments:
- choose No Collector for simplicity and low latency
- choose Bring Your Own Collector to reuse existing investments/effort
- choose Kedify OTel Collector for a turnkey scaling-focused metrics pipeline
This is not an exhausting list of options, some environments may use some older standards for dealing with metrics like OpenCensus, SNMP traps, New Relic, etc. The message here is also that if your monitoring solution can talk to OTel collector (and there is a myriad of possible integrations), it can also talk to KEDA.
If you’d like help selecting the best option or want to explore configuration details, reach out to us—we’re happy to help.