Kedify Dashboard
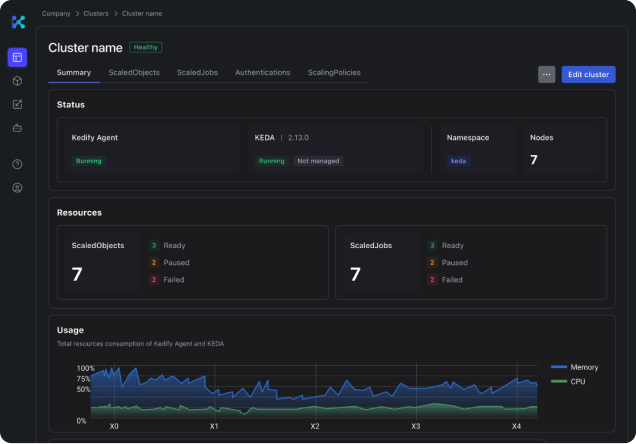
The dashboard provides a fleet view of independent Kedify-connected clusters, their components and workload scaling activity. It receives the enabled telemetry through each cluster’s Agent connection. Managing an estate is distinct from distributing one workload across clusters.
Connect and inspect a cluster
Section titled “Connect and inspect a cluster”- Select the Kubernetes context and the intended Kedify organization. Record the namespace and any existing KEDA installation.
- In the dashboard, select Connect Cluster, then follow Helm installation using that cluster’s installation identity.
- Find the cluster in the dashboard. Compare component versions and readiness with
kubectl get pods -n kedaandhelm list --all-namespaces. - Inspect one workload’s scaling activity. Check timestamps and filters; an Agent connection alone does not confirm that optional scalers are enabled.
For isolated KEDA operators and optional KPA controllers within a shared cluster, use Multi-tenant scaling and its installation guide.
If cluster data is missing or stale, check Agent readiness, organization identity and outbound gRPC connectivity. Use workload diagnostics when data arrives but scaling fails.
Use the right view for the question
Section titled “Use the right view for the question”- Component health and workload behavior: Workload diagnostics connects metrics and controller status to application outcomes.
- Resource recommendations: Insights shows advisory CPU/memory changes for monitored workloads.
- Capacity and estimated cost: FinOps explains windows, baselines and pricing coverage.
- Check scaling health: Autoscaling Checks tests the signal-to-replica path before expanding a rollout.
Fleet versus distribution
Section titled “Fleet versus distribution”Distributed multi-cluster scaling requires explicit member registration, remote access and placement policy; connecting clusters to the Dashboard does not register them for distributed scaling.
For organization credentials, telemetry and tenant boundaries, use Access and data boundaries. If a cluster’s data is stale, compare Agent connection and local status before interpreting dashboard values.