
OTel scaler configuration
Configure kedify-otel triggers, metric queries and ingestion below. Use OpenTelemetry metric scaling to understand the signal model and choose an ingestion method before configuring the pipeline.
The query syntax is a subset of PromQL. Collector/exporter endpoints and scaler query endpoints serve different purposes.
Verify the contract
Section titled “Verify the contract”Check a fresh source sample and the exact labels/units selected by the query before interpreting desired replicas. An OTLP receiver endpoint is different from the external-scaler endpoint even when one add-on provides both. Use the general non-GPU tutorial or vLLM model-metric tutorial, then workload diagnostics for missing/stale signals.
Metric Ingestion
Section titled “Metric Ingestion”In order to be able to scale workloads using custom metrics, these need to first be present in the scaler’s short-term in-memory db. Scaler exposes a regular gRPC OTLP receiver endpoint so there are several ways to set up your metric pipelines:
- PUSH based (OTLP receiver)
- PULL based (most of the time using the Prometheus receiver)
Direct Metrics Push
Section titled “Direct Metrics Push”Kedify OTel scaler exposes OTLP receiver on port 4317 using gRPC protocol, so metrics can be pushed directly from user workloads. OpenTelementry instrumentation SDKs for various languages provide similar ways to configure the tool.
One can configure the timeout, headers, SSL but most importantly the actual destination where the telemetry signals should be pushed. It is also possible to send metrics somewhere else than logs, traces and profiles. For metrics you can use the OTEL_EXPORTER_OTLP_METRICS_ENDPOINT environment variable. For more on this topic consult this and this.
Clear benefit of this approach is faster reaction time and no necessity for another OTel collector. On the other hand one can’t simply configure the fan out pattern where metrics will be sent to OTel scaler but also somewhere else for different purposes.
Sidecar Pattern
Section titled “Sidecar Pattern”A lightweight sidecar container with OTel collector is deployed together with the workload. This collector scrapes the metrics exposed by the workload using a loopback interface (example: http://localhost:8080/metrics) and send them to
the scaler. The sidecar collector can also do the filtering and send only the metric required for scaling.
OTel Operator’s admission webhook can be used to inject such sidecars. This approach also requires the cert-manager to be present in the k8s cluster.
Example values.yaml for deploying such setup:
otelOperator:  enabled: true  manager:    env: []  admissionWebhooks:    create: true
otelOperatorCrs:  - name: otel-sidecar-template    enabled: true    mode: sidecar    namespace: default    prometheusScrapeConfigs:      - job_name: "otel-collector"        scrape_interval: 5s        static_configs:          - targets: ["localhost:8000"]    includeMetrics:      - vllm:gpu_cache_usage_perc      - vllm:num_requests_waiting
This also requires that pods that should receive the sidecar container have following annotation on them: sidecar.opentelemetry.io/inject: "otel-sidecar-template". For more details please consult docs of OTel Operator.
Static Targets
Section titled “Static Targets”List each scrape target as host:port. The default path is /metrics; use metrics_path in the scrape job for a different path, as described in the Prometheus configuration reference.
Example values.yaml for deploying such setup:
otelOperator:  enabled: true
otelOperatorCrs:  - name: scrape-static-targets    enabled: true    prometheusScrapeConfigs:      - job_name: "services"        scrape_interval: 5s        static_configs:          - targets: ["keda-otel-scaler.keda.svc:8080"]          - targets: ["kedify-predictor.keda.svc:8081"]          - targets: ["my-workload.prod.svc:8080"]    includeMetrics:      - http_requests_total      - keda_internal_metricsservice_grpc_client_msg_received_total      - active_shopping_carts
More advanced example that scrapes the NVIDIA DCGM metrics.
Kubernetes Service Discovery
Section titled “Kubernetes Service Discovery”Prometheus OTel receiver supports full configuration as official Prometheus server. This allows to use their Kubernetes Service Discovery feature to dynamically specify the targets for scraping.
Here is an example that will scrape any pods that have certain annotation on them:
... prometheusScrapeConfigs: - job_name: 'k8s' scrape_interval: 5s kubernetes_sd_configs: - role: pod relabel_configs: - source_labels: [__meta_kubernetes_pod_annotation_kedify_io_scrape] regex: "true" action: keep - source_labels: [__meta_kubernetes_pod_annotation_kedify_io_path] action: replace target_label: __metrics_path__ regex: (.+) - source_labels: [__address__, __meta_kubernetes_pod_annotation_kedify_io_port] action: replace target_label: __address__ regex: (.+)(?::\d+);(\d+) replacement: $1:$2 - source_labels: [__meta_kubernetes_pod_annotation_kedify_io_scheme] action: replace target_label: __scheme__ regex: (.+) # all the 'implicit' labels starting with __ will be dropped, so we need to preserve the pod identity - source_labels: [__meta_kubernetes_pod_name] action: replace target_label: pod_nameThen all the pods with kedify.io/scrape: "true" annotation will be scraped for "http//:8080/metrics" endpoint. Which can be further configured using annotations:
kedify.io/path(default:"/metrics")kedify.io/port(default:"8080")kedify.io/scheme(default:"http")
Target Allocator
Section titled “Target Allocator”Yet another approach to get the metrics in, is using the Target Allocator feature of OTel Operator. This way, one can describe the targets for metrics scraping using Prometheus Operator’s CRDs:
PodMonitorServiceMonitor
This approach doesn’t require the Prometheus Operator nor Prometheus Server to be running in the cluster, however the CRDs are assumed to be present by OTel Operator.
Full example:
helm upgrade -i prometheus oci://ghcr.io/prometheus-community/charts/kube-prometheus-stack --version 80.6.0 \                --set kubeStateMetrics.enabled=false \                --set nodeExporter.enabled=false \                --set grafana.enabled=false \                --set alertmanager.enabled=falsekubectl scale statefulset/prometheus-prometheus-kube-prometheus-prometheus deploy/prometheus-kube-prometheus-operator --replicas=0
cat <<VALS | helm upgrade -i keda-otel-scaler --create-namespace oci://ghcr.io/kedify/charts/otel-add-on -nkeda --version=vx.y.z -f -otelOperator:  enabled: trueotelOperatorCrs:- name: target-allocator  enabled: true  targetAllocatorEnabled: true  targetAllocatorClusterRoles:  - prometheus-kube-prometheus-operator  - prometheus-kube-prometheus-prometheus  prometheusCR:    targetAllocator:      # potentially further narrow the ServiceMonitor CRs (labels)      serviceMonitorSelector: {}VALS
This method also assumes the two cluster roles to be present in the cluster called kube-prometheus-stack-operator & kube-prometheus-stack-prometheus (default names when installing Prometheus stack helm chart) that have CRUD enabled for Prometheus’ CRDs. If the cluster roles are called differently, you may want to change the otelOperatorCrs[0].targetAllocatorClusterRoles array as in the example (different versions of upstream Prometheus helm chat had different names for the clusterroles).
(more options for the values)
Operation Over Time
Section titled “Operation Over Time”The operationOverTime parameter specifies how time-series data for a selected metric should be processed over a period of time. This enables the scaler to apply transformations such as calculating the rate of change or finding the average, minimum, or maximum values.
Available Options:
Section titled “Available Options:”last_one: Returns the most recent metric value.min: Returns the minimum value within the time window.max: Returns the maximum value within the time window.avg: Returns the average of the values within the time window.rate: Calculates the rate of change over the time window, useful for metrics that represent counts.count: Counts the total number of metric samples within the time window.
Example Behaviors:
Section titled “Example Behaviors:”Assuming metric values at times t1, t2, t3…:
| Time Series | t1 | t2 | t3 | t4 | t5 | t6 | t7 | Result (for operationOverTime) |
|---|---|---|---|---|---|---|---|---|
| last_one | 3 | 2 | 1 | 6 | 3 | 2 | 3 | 3 |
| min | 3 | 2 | 1 | 6 | 3 | 2 | 3 | 1 |
| max | 3 | 2 | 1 | 6 | 3 | 2 | 3 | 6 |
| avg | 3 | 2 | 1 | 6 | 3 | 2 | 3 | round(20/7) = 3 |
| rate | 1 | 2 | 3 | 4 | 5 | 6 | 7 | 1 (assuming measurements each second) |
| count | 3 | 2 | 1 | 6 | 3 | 2 | 3 | 7 |
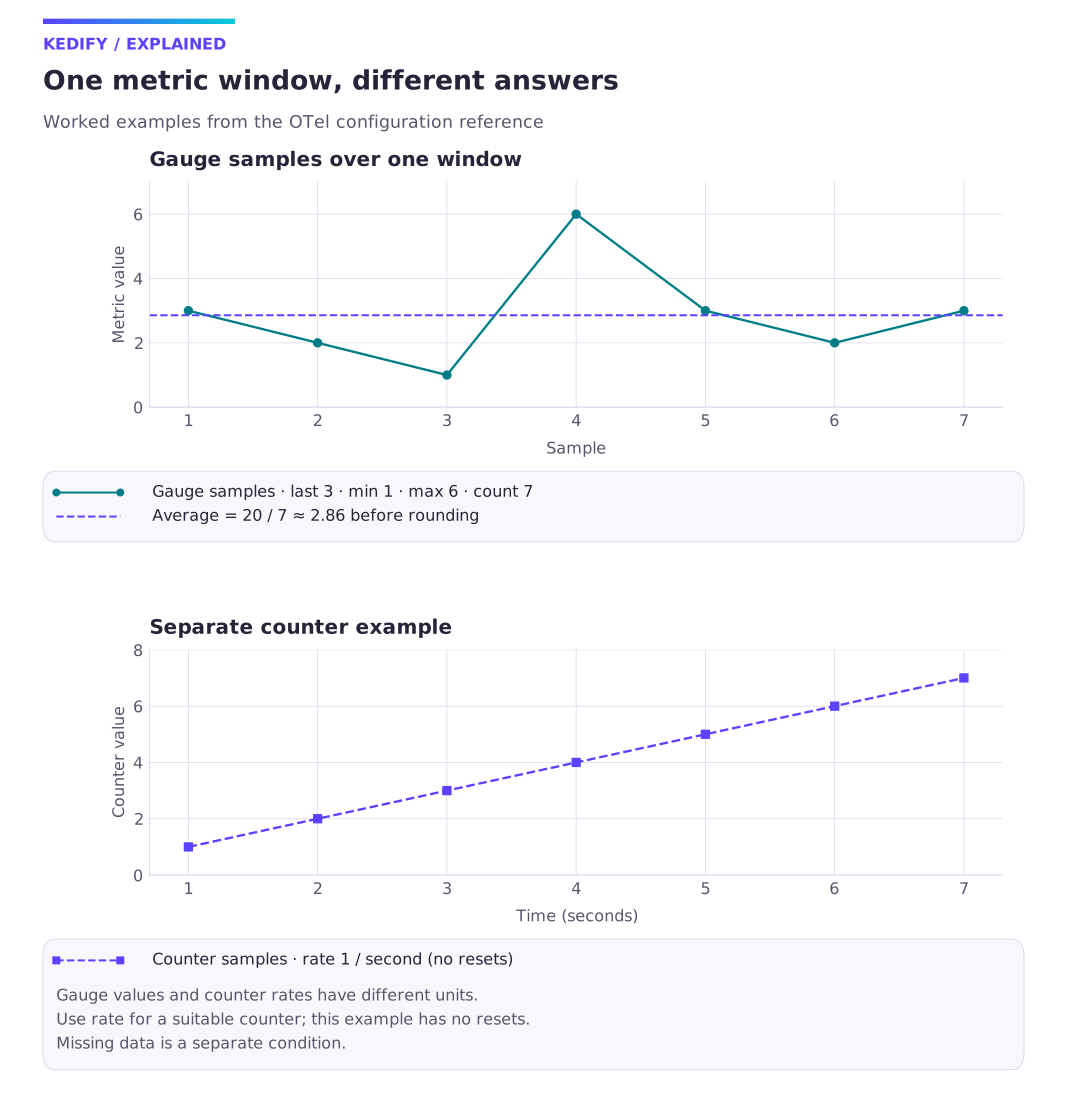
Diagram description
Gauge values 3, 2, 1, 6, 3, 2, 3 yield last 3, minimum 1, maximum 6, count 7 and an exact average of 20/7. The separate counter has a rate of one per second.
The graph shows the exact average before rounding. Gauge values and counter rates have different units; choose the operation and target together. Missing samples are handled separately under missing metrics and retention.
Metric Query Syntax
Section titled “Metric Query Syntax”The metricQuery parameter in the OTEL Scaler specifies the exact metric to be monitored and is similar to a simplified PromQL query. It allows selecting a single metric and filtering based on labels. Optionally, an aggregation function can be used around the metric to perform basic calculations.
-
Basic Syntax:
op(metricName{label1=val1, label2=val2})opis an optional aggregation function that can be one ofsum,avg,min, ormax.metricNamerefers to the specific metric being tracked.- Labels can be included in the format
{label1=val1, label2=val2}to filter the metric by specific dimensions. - Note:
val1can be in quotes (e.g.,"val1") but does not have to be.
-
Supported Aggregation Functions:
{sum, avg, min, max}- If an aggregation function is not specified,
sumis used by default.
-
Examples:
avg(http_requests_total{code=200,handler=targets,instance=example:8080,method=GET})up{instance="prod:8080"}foobar(single metric without filters or aggregation function)
-
Limitations:
- Only simple
=operators are supported in label selectors. Advanced operators, such as!=or=~, are not supported. - Multiple metric names cannot be combined in a single query.
- No arithmetic operations are supported directly within the query.
- Only simple
Note: The OTEL collector can apply simple arithmetic to metrics using a processor, which allows further customization of metric data before it is passed to the scaler. For more details, refer to the OTEL Add-on README.
Trigger Specification
Section titled “Trigger Specification”This specification describes the kedify-otel trigger, which scales workloads based on metrics collected by OTEL.
Here is an example trigger configuration using the Kedify OTEL scaler:
triggers: - type: kedify-otel metadata: metricQuery: "avg(http_server_request_count{app_id=nodeapp, method=GET, path=/v1.0/state/statestore})" targetValue: "5" clampMin: "0" clampMax: "10" operationOverTime: "rate" scalerAddress: "keda-otel-scaler.${kedaNs}.svc:4318" # optional - to overwrite auto-injected add-on URLParameter list:
Section titled “Parameter list:”metricQuery: Specifies the exact metric and its filters. See Metric Query Syntax for details.targetValue: The desired target value for the selected metric, which will trigger scaling adjustments (e.g.,5).clampMin(optional): Lower bound for the returned metric value, in the metric’s units.clampMax(optional): Upper bound for the returned metric value, in the metric’s units.operationOverTime(optional): Defines the time-series operation over the specified time window. See Operation Over Time for more details.scalerAddress: The configurable gRPC endpoint where the OTEL scaler is running. If not set, Kedify will inject the correct value (e.g.,keda-otel-scaler.${kedaNs}.svc:4318, Optional).
Missing metrics and retention
Section titled “Missing metrics and retention”The OTel scaler keeps metric history in memory. With the following otel-add-on chart settings, an absent series returns a successful zero value rather than an error:
settings: metricStore: retentionSeconds: 120 errIfNotFound: false valueIfNotFound: 0These are the defaults in OTel Add-on chart 0.1.4; check your selected chart with helm show values before changing them. A restart loses in-memory history. A series can also disappear when collection stops, labels change or samples age out of the retention window. A zero response does not activate an error-based KEDA fallback. Set errIfNotFound: true if an absent series must be reported as an error, and verify the selected scaler/fallback behavior with a deliberately interrupted metric feed.
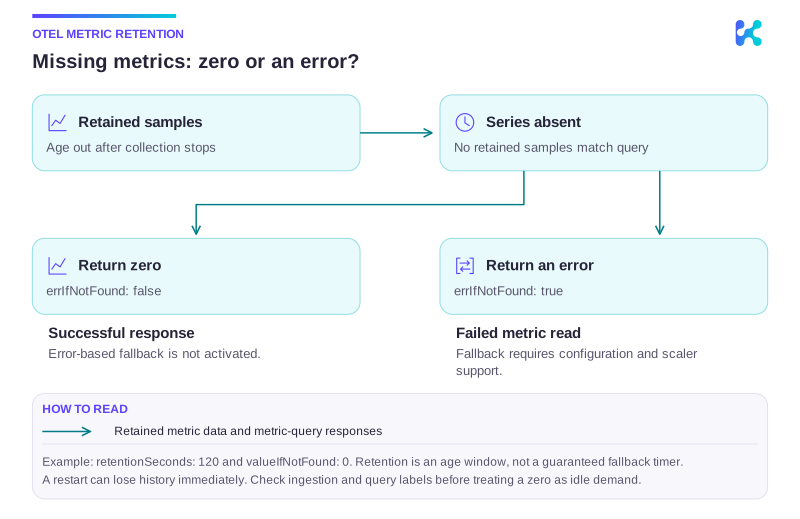
Diagram description
After collection stops, retained OTel samples eventually age out. Once the queried series is absent, errIfNotFound=false returns valueIfNotFound (zero in this example), a successful metric response that does not trigger error-based fallback. errIfNotFound=true reports an error; fallback then depends on KEDA configuration and scaler support. Restarts can lose in-memory history immediately.
Inspect the query and collector/exporter health before interpreting zero as idle demand. See OTel ingestion verification and workload diagnostics.
clampMin and clampMax apply to a found metric value, not the desired replica count. For example, clampMax: "10" with targetValue: "5" caps the input signal at 10 metric units. Set spec.minReplicaCount and spec.maxReplicaCount on the ScaledObject to bound replicas.