
OpenTelemetry scaler
The kedify-otel scaler evaluates application metrics in a short-term in-memory store. Use it in a ScaledObject or ScaledJob with a query and target value. Metrics can arrive directly over OTLP or through an OpenTelemetry Collector.
Set up a metric source
Section titled “Set up a metric source”Start with a working OTel example. Choose direct OTLP, sidecar, discovery or collector ingestion for your deployment. Existing recipes cover Prometheus migration, Ingress NGINX metrics and vLLM metrics.
For HTTP proxy and interceptor request traces, see OpenTelemetry tracing.
Architecture
Section titled “Architecture”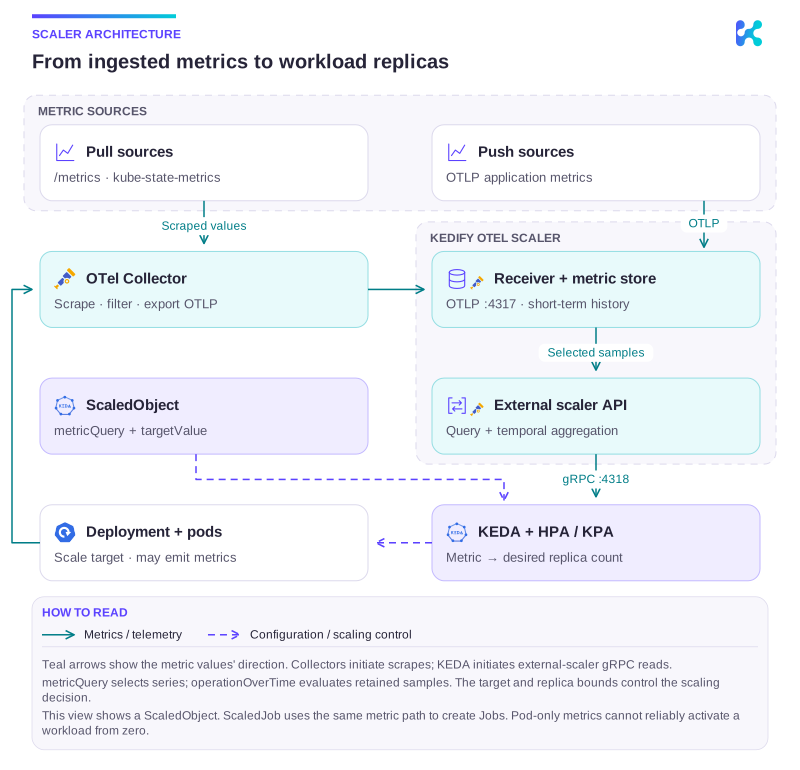
Diagram description
Pull sources and workload endpoints are scraped by an OpenTelemetry Collector; push sources emit OTLP directly. The OTel scaler's OTLP receiver writes a short-term in-memory metric store. Its external-scaler API selects and aggregates samples using the ScaledObject metricQuery and operationOverTime. KEDA reads the result over gRPC, and KEDA with HPA or KPA updates the target workload. The same workload can provide the measured signal, closing the feedback loop.
Example ScaledObject with Kedify OTEL Trigger
Section titled “Example ScaledObject with Kedify OTEL Trigger”Here is a full example of a ScaledObject definition using the Kedify OTEL trigger, including advanced configurations for the horizontalPodAutoscalerConfig:
apiVersion: keda.sh/v1alpha1kind: ScaledObjectmetadata: name: otel-examplespec: scaleTargetRef: name: nodeapp triggers: - type: kedify-otel metadata: scalerAddress: "keda-otel-scaler.default.svc:4318" metricQuery: "avg(http_server_request_count{app_id=nodeapp, method=GET, path=/v1.0/state/statestore})" targetValue: "5" clampMin: "0" clampMax: "10" operationOverTime: "rate" advanced: horizontalPodAutoscalerConfig: behavior: scaleDown: stabilizationWindowSeconds: 10 scaleUp: stabilizationWindowSeconds: 10Verify and tune
Section titled “Verify and tune”Generate representative demand and confirm the query returns fresh values with the intended labels and units. Inspect ScaledObject/ScaledJob status, desired replicas or jobs, ready capacity, and application latency or backlog. Metrics emitted only by stopped pods cannot reliably activate a workload from zero.
Use KEDA tuning for polling, caching, fallback and stabilization. Diagnose stale or missing metrics with workload troubleshooting.
For a visual comparison of last_one, avg, max and counter rates, see the worked metric-window graph.
Configuration reference
Section titled “Configuration reference”OTel configuration covers query syntax, temporal operations, ingestion and all trigger fields.