FinOps
Kedify FinOps shows how monitored cluster capacity translates into estimated spend and saved compute. It connects autoscaling behavior with capacity and cost signals, so you can see which clusters are running below recent peaks and where the largest savings opportunities are.
What FinOps Shows
Section titled “What FinOps Shows”FinOps is available at organization and cluster level. The organization view compares monitored clusters. The cluster view drills into one cluster with the same time window and compute type (nodes, CPU, memory, or GPU).
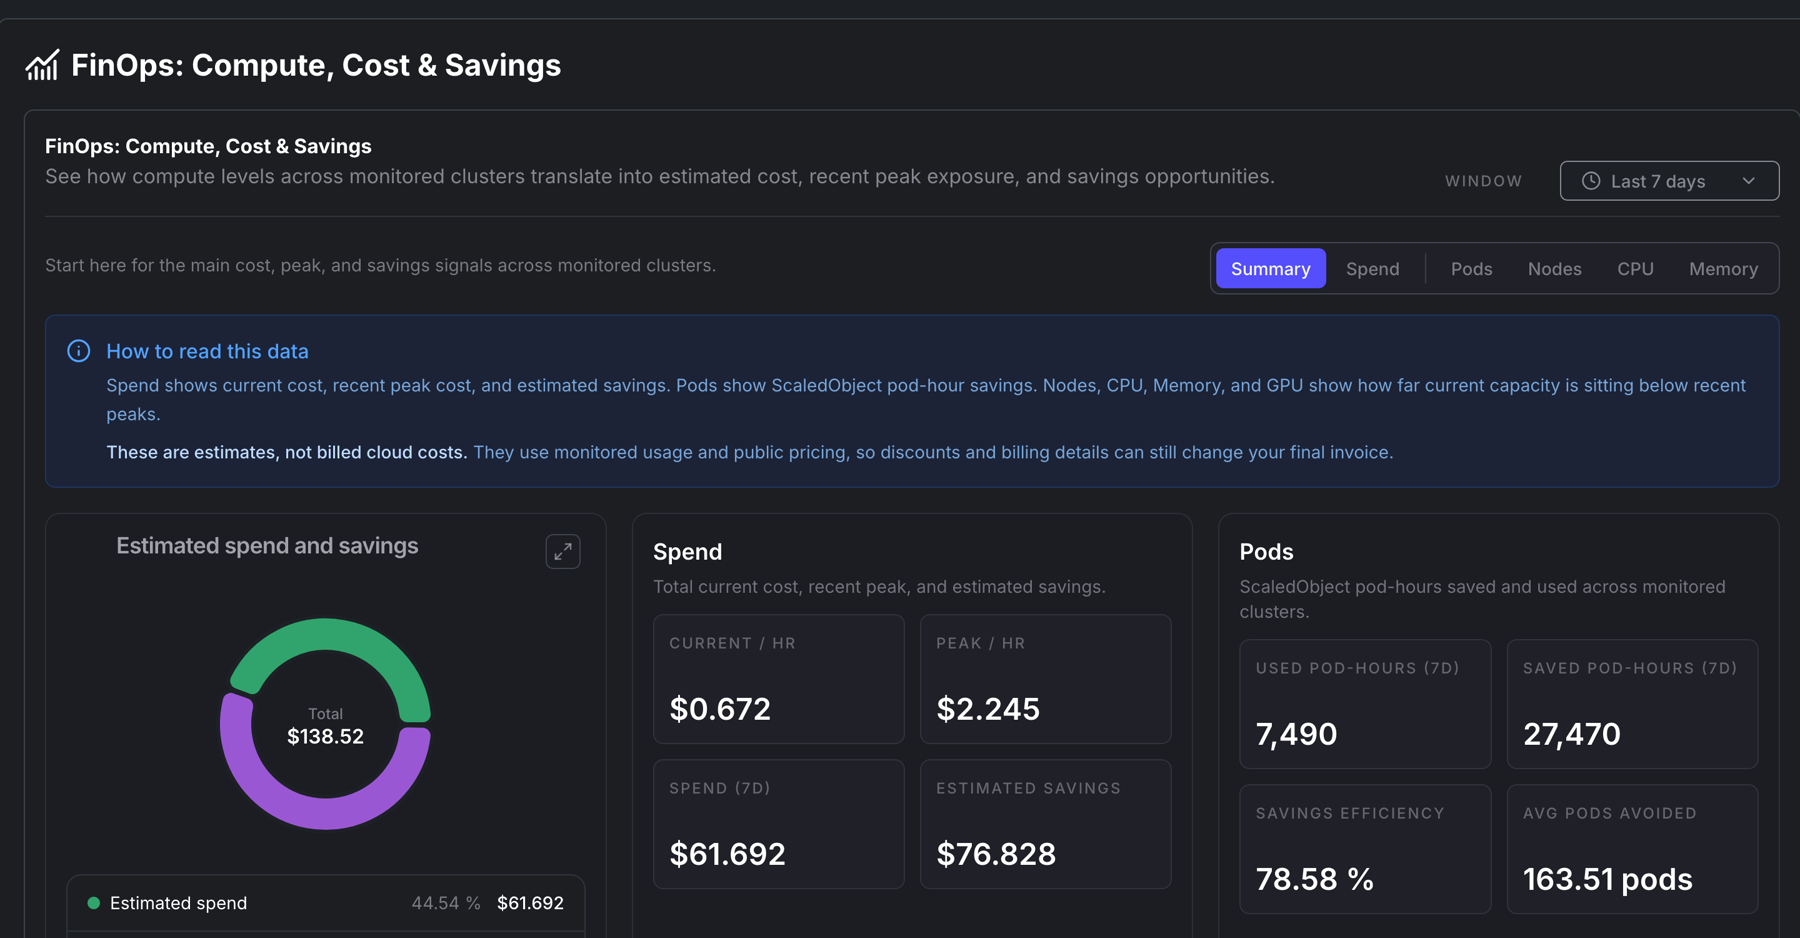
The main views are:
- Summary: current cost, recent peak, estimated savings, and saved capacity by compute type
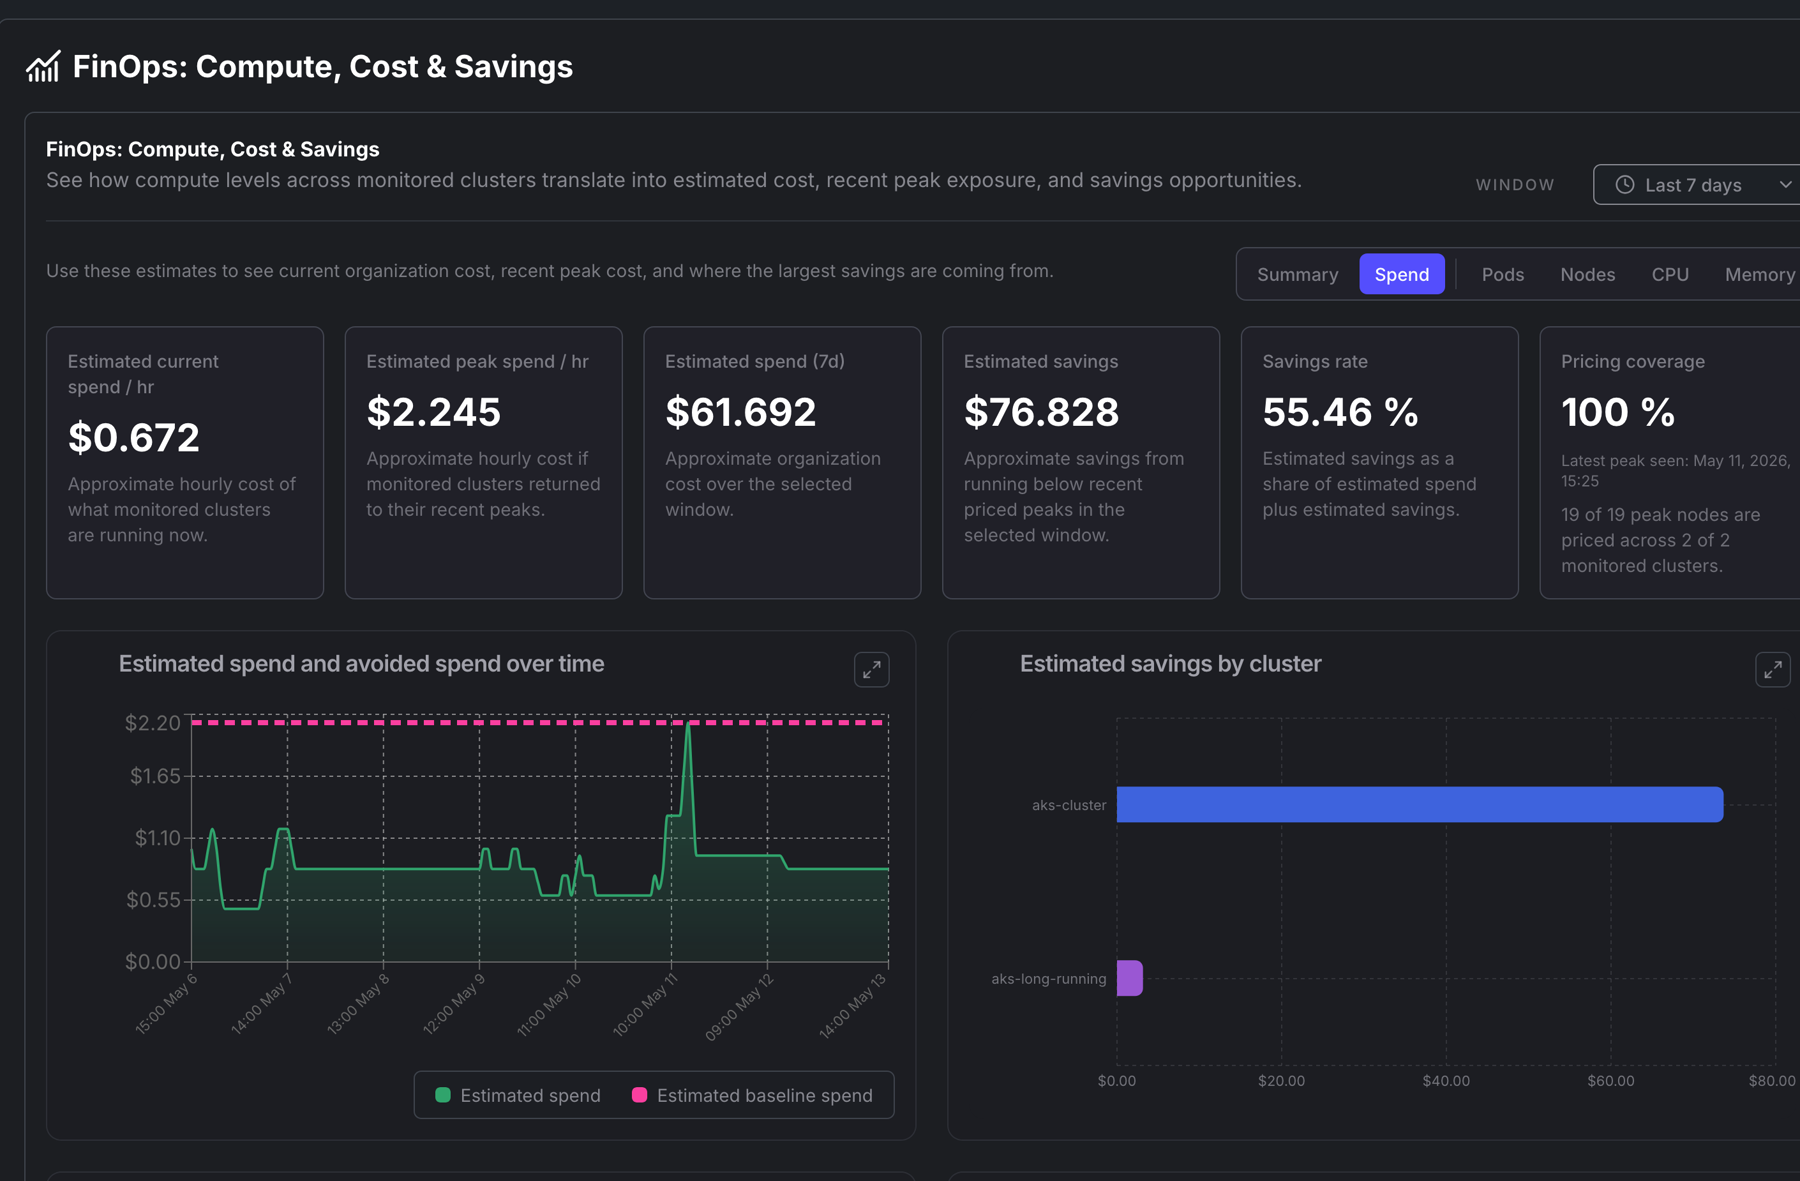
- Spend: estimated current spend, peak spend, window spend, savings rate, and peak cost drivers
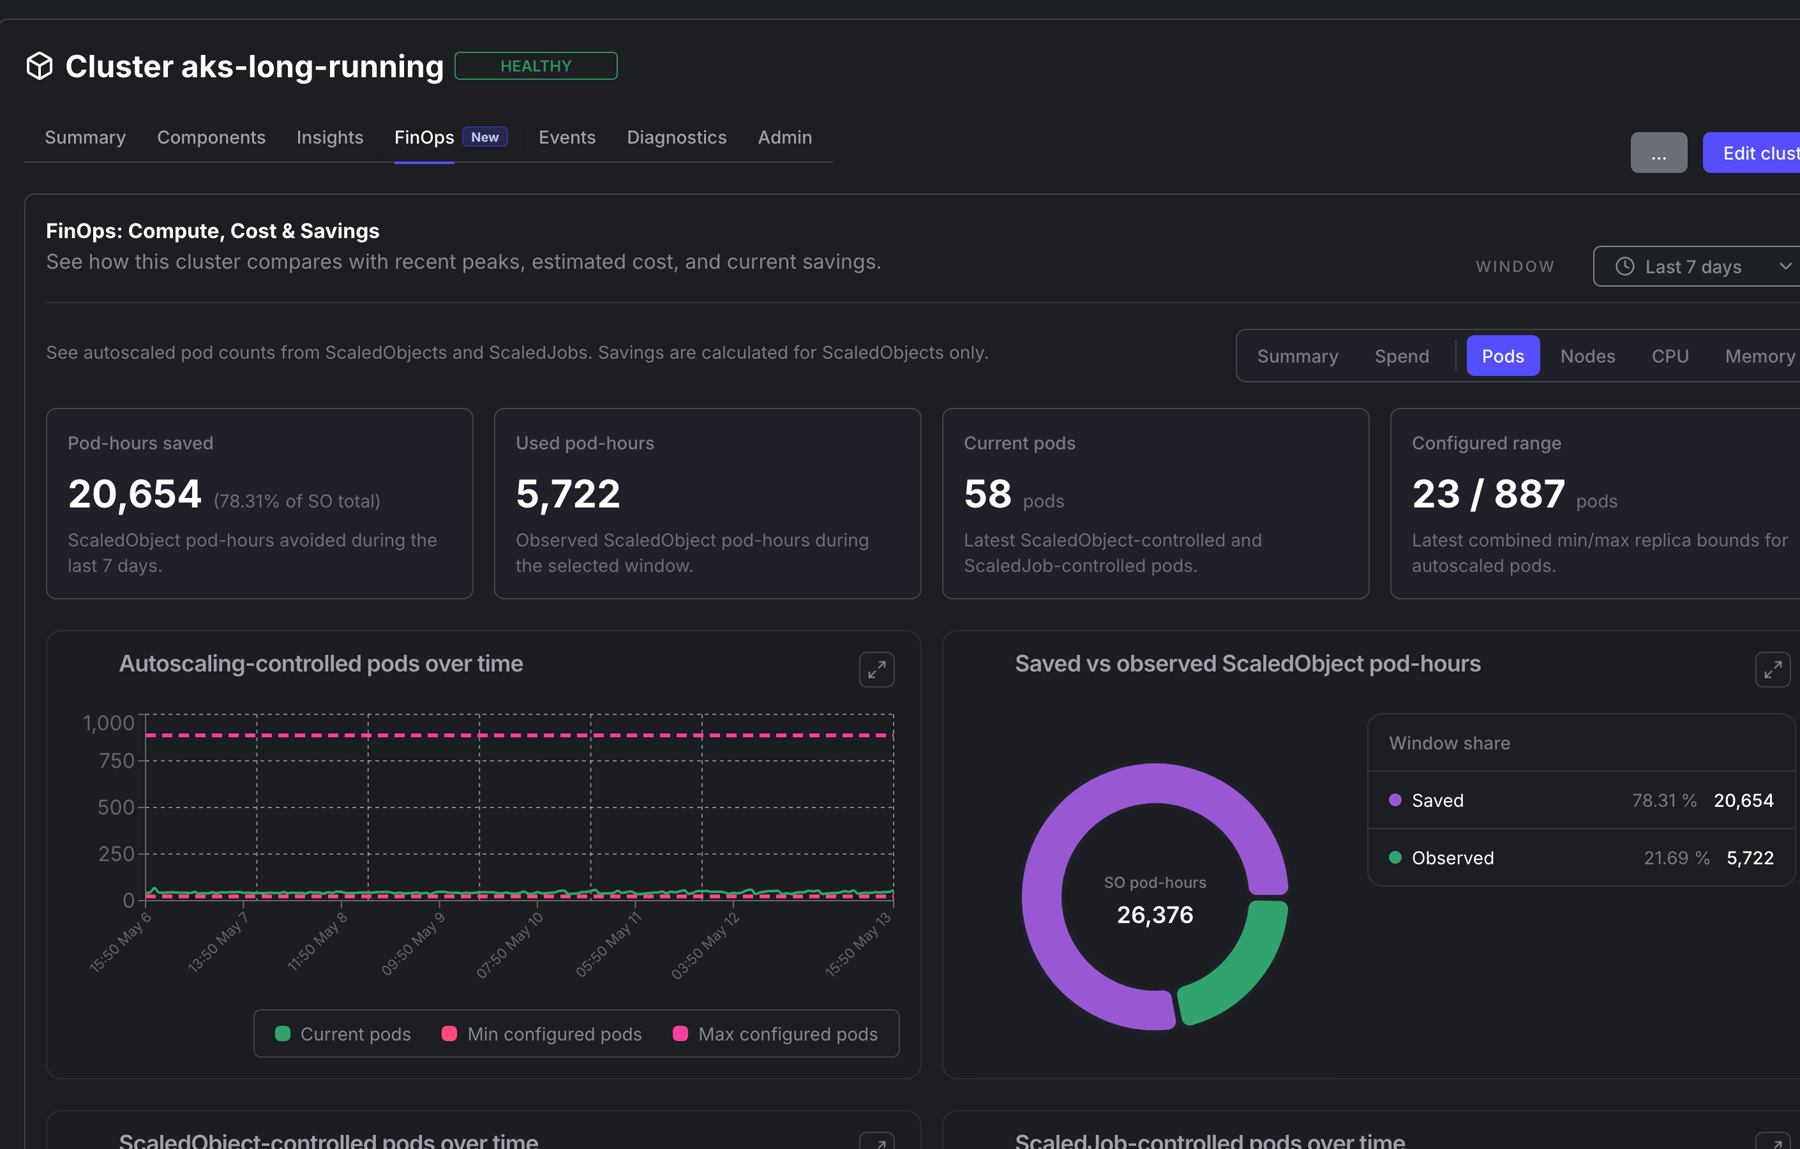
- Pods: ScaledObject pod-hours saved and used, plus autoscaled pod counts over time
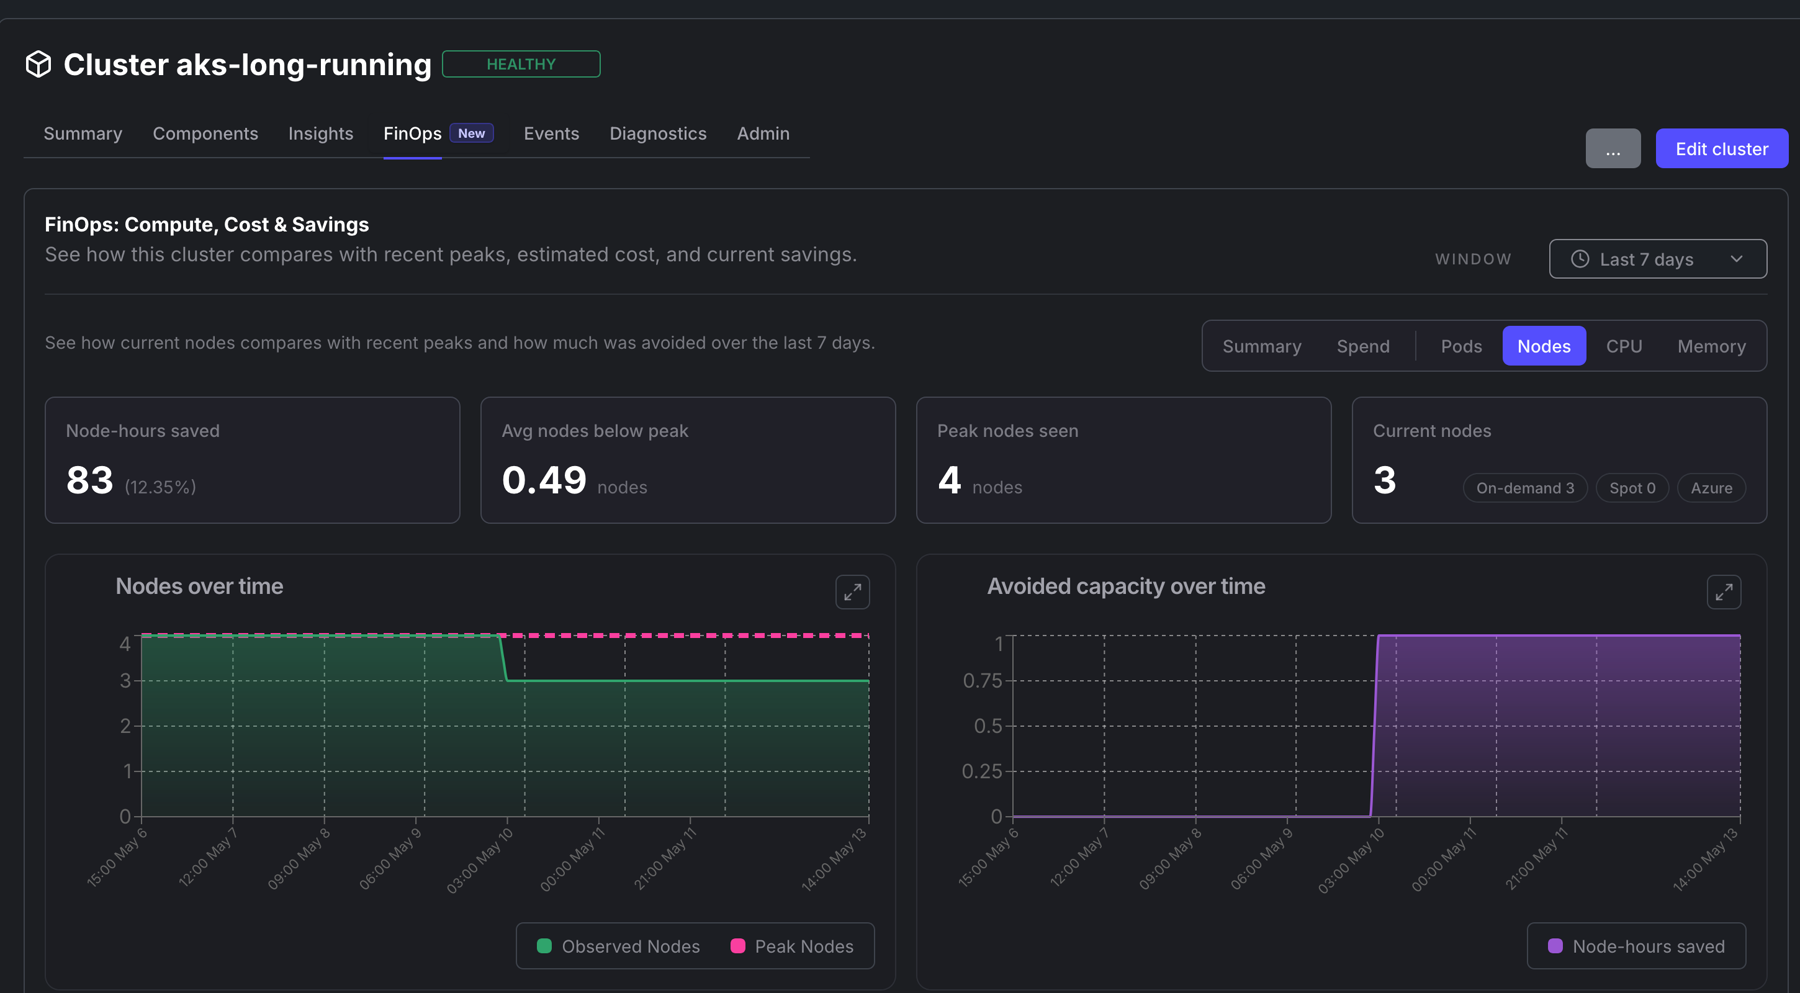
- Nodes, CPU, Memory, and GPU: observed capacity, recent peak capacity, saved capacity, and efficiency
How Savings Are Estimated
Section titled “How Savings Are Estimated”Kedify compares observed capacity during the selected window with a recent peak baseline. The difference is shown as saved compute-hours, such as node-hours, core-hours, GiB-hours, or GPU-node-hours.
Pod savings use ScaledObject data: saved pod-hours compare configured maximum replicas with the replicas that actually ran. ScaledJob pod counts can appear in pod charts, but ScaledObject data is the savings basis.
Spend estimates use the captured peak node mix, cloud provider metadata, and public pricing. The pricing coverage section shows how much of the peak node mix has price data.
Spend and Capacity Drilldowns
Section titled “Spend and Capacity Drilldowns”Use the Spend view to see hourly run-rate, daily estimated savings, current-cost share, and peak cost drivers such as instance type and capacity class.
Cluster drilldowns help explain why a cluster is contributing to cost or savings. For example, node details show current nodes, peak nodes, avoided node-hours, instance type mix, and on-demand versus spot capacity.
Using FinOps Data
Section titled “Using FinOps Data”Use FinOps to prioritize where to investigate first:
- compare 7-day and 30-day windows before making capacity decisions
- check pricing coverage before relying on cost totals
- open high-savings clusters to inspect pods, nodes, CPU, and memory separately
- use Insights alongside FinOps when saved capacity points to workloads with oversized resource requests