Kedify Predictive Scaler - Example Setup
This guide will walk you through setting up an example application that first sends the metrics (through KEDA) into the Predictor’s time-series metric store and once the model is ready, we can plug it in to drive the scaling using predicted future values. This way we can react proactively to anticipated load spikes.
Using the scaling modifiers, we can implement a combination of real measured events with anticipated metrics that suits our business needs.
Set up the Full Demo Using One Command
Section titled “Set up the Full Demo Using One Command”# create k8s cluster or use an existing onek3d cluster createexport ORG_ID=**export API_KEY=kfy_**# this deploys everything using the extraPostInstallObjects array w/ k8s manifestshelm repo update kedifykedacat <<PREDICTORVALUES | helm upgrade -i kedify-agent kedifykeda/kedify-agent --create-namespace -n keda -f -clusterName: predictor-demokeda: enabled: true env: - name: RAW_METRICS_GRPC_PROTOCOL value: enabled - name: RAW_METRICS_MODE value: pollingintervalkeda-add-ons-http: enabled: truekedify-predictor: enabled: trueagent: orgId: ${ORG_ID} apiKey: ${API_KEY}
extraPostInstallObjects: # Deployment & Service that feeds the metrics-api scaler - apiVersion: apps/v1 kind: Deployment metadata: name: mm namespace: default spec: replicas: 1 selector: matchLabels: app: mm template: metadata: labels: app: mm spec: containers: - name: main image: ghcr.io/kedify/sample-minute-metrics ports: - containerPort: 8080 env: - name: INTERPOLATE_VALUES value: "true" - name: TIME_RELATIVE_TO_START value: "false" - name: CYCLE_MINUTES value: "1440" - name: SCHEDULE # simulating two traffic peaks during a day value: "0:2,60:4,120:5,180:13,240:38,300:109,360:329,420:715,480:1408,540:2001,600:2393,660:2111,720:1450,780:888,840:682,900:744,960:1053,1020:1485,1080:1777,1140:1876,1200:1655,1260:1209,1320:836,1380:445,1410:100" - apiVersion: v1 kind: Service metadata: name: mm namespace: default spec: selector: app: mm ports: - protocol: TCP port: 80 targetPort: 8080 - apiVersion: keda.sh/v1alpha1 kind: ScaledObject metadata: name: mm namespace: default spec: scaleTargetRef: name: demo pollingInterval: 10 cooldownPeriod: 5 minReplicaCount: 0 maxReplicaCount: 6 advanced: scalingModifiers: formula: "(mm + mmInTenMinutes)/2" target: "400" metricType: "AverageValue" horizontalPodAutoscalerConfig: behavior: scaleUp: stabilizationWindowSeconds: 0 scaleDown: stabilizationWindowSeconds: 0 triggers: - type: metrics-api name: mm metadata: url: "http://mm.default.svc.cluster.local/api/v1/minutemetrics" valueLocation: "value" targetValue: "400" - type: kedify-predictive name: mmInTenMinutes metadata: modelName: mm-in-ten targetValue: "400" # Simple demo app that is subject of scaling (Deployment, Service & two ConfigMaps) - apiVersion: apps/v1 kind: Deployment metadata: name: demo namespace: default spec: selector: matchLabels: app: demo strategy: type: Recreate template: metadata: labels: app: demo spec: containers: - name: nginx image: nginx ports: - containerPort: 8080 volumeMounts: - name: nginx-config mountPath: /etc/nginx/conf.d/default.conf subPath: nginx.conf - name: nginx-index mountPath: /usr/share/nginx/html/ volumes: - name: nginx-index configMap: name: demo-index-html defaultMode: 420 - name: nginx-config configMap: name: demo-config defaultMode: 420 - apiVersion: v1 kind: Service metadata: name: demo namespace: default spec: ports: - port: 8080 name: http selector: app: demo - apiVersion: v1 kind: ConfigMap metadata: name: demo-config namespace: default data: nginx.conf: | server { listen 8080; root /usr/share/nginx/html/; location /status { stub_status on; access_log on; allow all; } location / { } } - apiVersion: v1 kind: ConfigMap metadata: name: demo-index-html namespace: default data: index.html: | E-shop
# CR for kedify-predictor where we request the metric subscription on trigger called 'mm' - kind: MetricPredictor apiVersion: keda.kedify.io/v1alpha1 metadata: name: mm-in-ten namespace: default spec: source: keda: name: mm triggerName: mm oneShotCsv: url: https://storage.googleapis.com/kedify-predictor/website_traffic_4weeks_30s.csv addTimestamps: true timestampPeriod: 30s model: type: Prophet name: mm-in-ten defaultHorizon: 10m retrainInterval: 1dPREDICTORVALUESStep-by-step Demo
Section titled “Step-by-step Demo”Let’s set up the same demo from scratch and describe the steps further.
0. Enable the Predictor
Section titled “0. Enable the Predictor”Follow this guide to do that. We also assume the Kedify Agent and KEDA have been installed into keda namespace. Don’t forget to also enable the raw-metrics for KEDA.
1. Deploy an application that exposes the metrics-api
Section titled “1. Deploy an application that exposes the metrics-api”This application simulates incoming traffic metrics to our e-shop. It has a schedule provided as a comma-separated list of key-value pairs stored in an environment variable. The key is number of minutes from midnight and the value is the number of incoming requests
apiVersion: apps/v1kind: Deploymentmetadata: name: mm namespace: defaultspec: selector: matchLabels: app: mm template: metadata: labels: app: mm spec: containers: - name: main image: ghcr.io/kedify/sample-minute-metrics ports: - containerPort: 8080 env: - name: INTERPOLATE_VALUES value: "true" - name: TIME_RELATIVE_TO_START value: "false" # absolute clock - name: CYCLE_MINUTES value: "1440" # 60*24 - name: SCHEDULE # simulating two traffic peaks during a day value: "0:2,60:4,120:5,180:13,240:38,300:109,360:329,420:715,480:1408,540:2001,600:2393,660:2111,720:1450,780:888,840:682,900:744,960:1053,1020:1485,1080:1777,1140:1876,1200:1655,1260:1209,1320:836,1380:445,1410:100"---apiVersion: v1kind: Servicemetadata: name: mm namespace: defaultspec: selector: app: mm ports: - protocol: TCP port: 80 targetPort: 8080Finally, let’s create the application that will be scaled by KEDA.
helm upgrade -i podinfo oci://ghcr.io/stefanprodan/charts/podinfo \ --set ui.message=E-shop \ --set color=#222222 \ --set ui.logo=https://kedify.io/assets/images/logo.svg2. Create a ScaledObject for KEDA
Section titled “2. Create a ScaledObject for KEDA”This way we describe the scaling behavior that translates the number of incoming requests to number of desired replicas. We set targetValue to 400 since it is an ok load to be handled by one replica. Following this logic, if number of request is, say, ~1600, it should spawn four pods.
apiVersion: keda.sh/v1alpha1kind: ScaledObjectmetadata: name: mm namespace: defaultspec: scaleTargetRef: name: podinfo pollingInterval: 10 cooldownPeriod: 5 minReplicaCount: 0 maxReplicaCount: 6 advanced: horizontalPodAutoscalerConfig: behavior: scaleUp: stabilizationWindowSeconds: 0 scaleDown: stabilizationWindowSeconds: 0 triggers: - type: metrics-api name: mm metadata: url: "http://mm.default.svc.cluster.local/api/v1/minutemetrics" valueLocation: "value" targetValue: "400"Up until now, it is classic KEDA with a metrics-api scaler. If we want the Predictor to be able to capture the seasonal patterns and forecast values, we need to let it train from the data.
3. Create a MetricPredictor CR
Section titled “3. Create a MetricPredictor CR”kind: MetricPredictorapiVersion: keda.kedify.io/v1alpha1metadata: name: mm-in-ten namespace: defaultspec: source: keda: name: mm triggerName: mm oneShotCsv: url: https://storage.googleapis.com/kedify-predictor/website_traffic_4weeks_30s.csv addTimestamps: true timestampPeriod: 30s model: type: Prophet name: mm-in-ten defaultHorizon: 10m retrainInterval: 1dAfter creating the MetricPredictor resource, the metric data will start flowing from KEDA to Kedify Predictor where predictor stores it in its own database. Kedify predictor controller makes sure the model is retrained at configured intervals. This way we can be sure the model will not become obsolete and will react to a potential concept drifts in the data.
4. Check the Model
Section titled “4. Check the Model”Before starting to use the trained model for predictions, it is a good practice to eyeball the graph of predicted values. During training, the model is evaluated using the MAPE score, but visual representation of the predictions is always priceless.
kubectl port-forward -n keda svc/kedify-predictor 8000open 'http://localhost:8000/models/mm-in-ten/graph?hoursAgo=150&dataHoursAgo=600&periods=600&legend=T'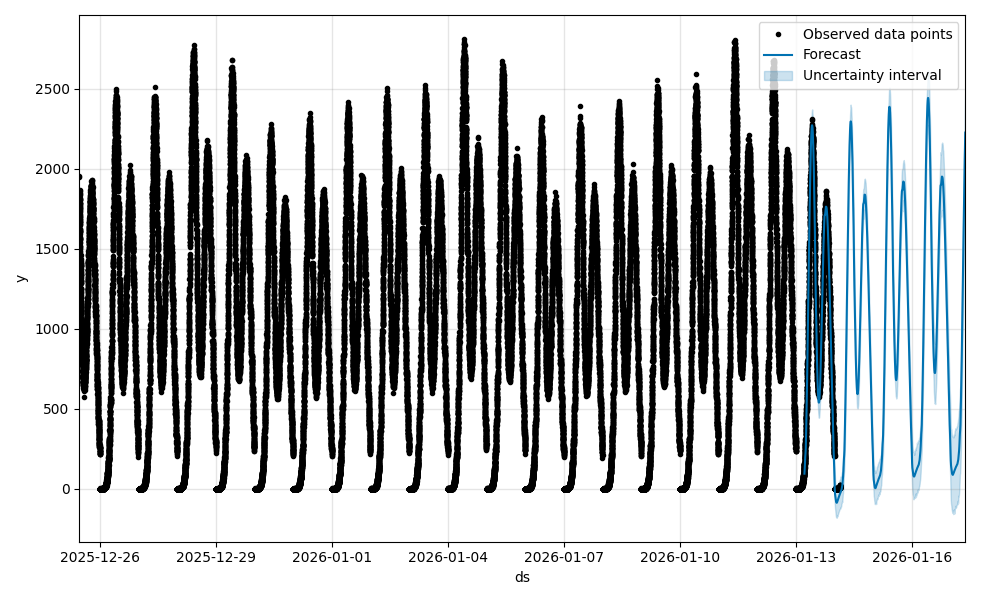
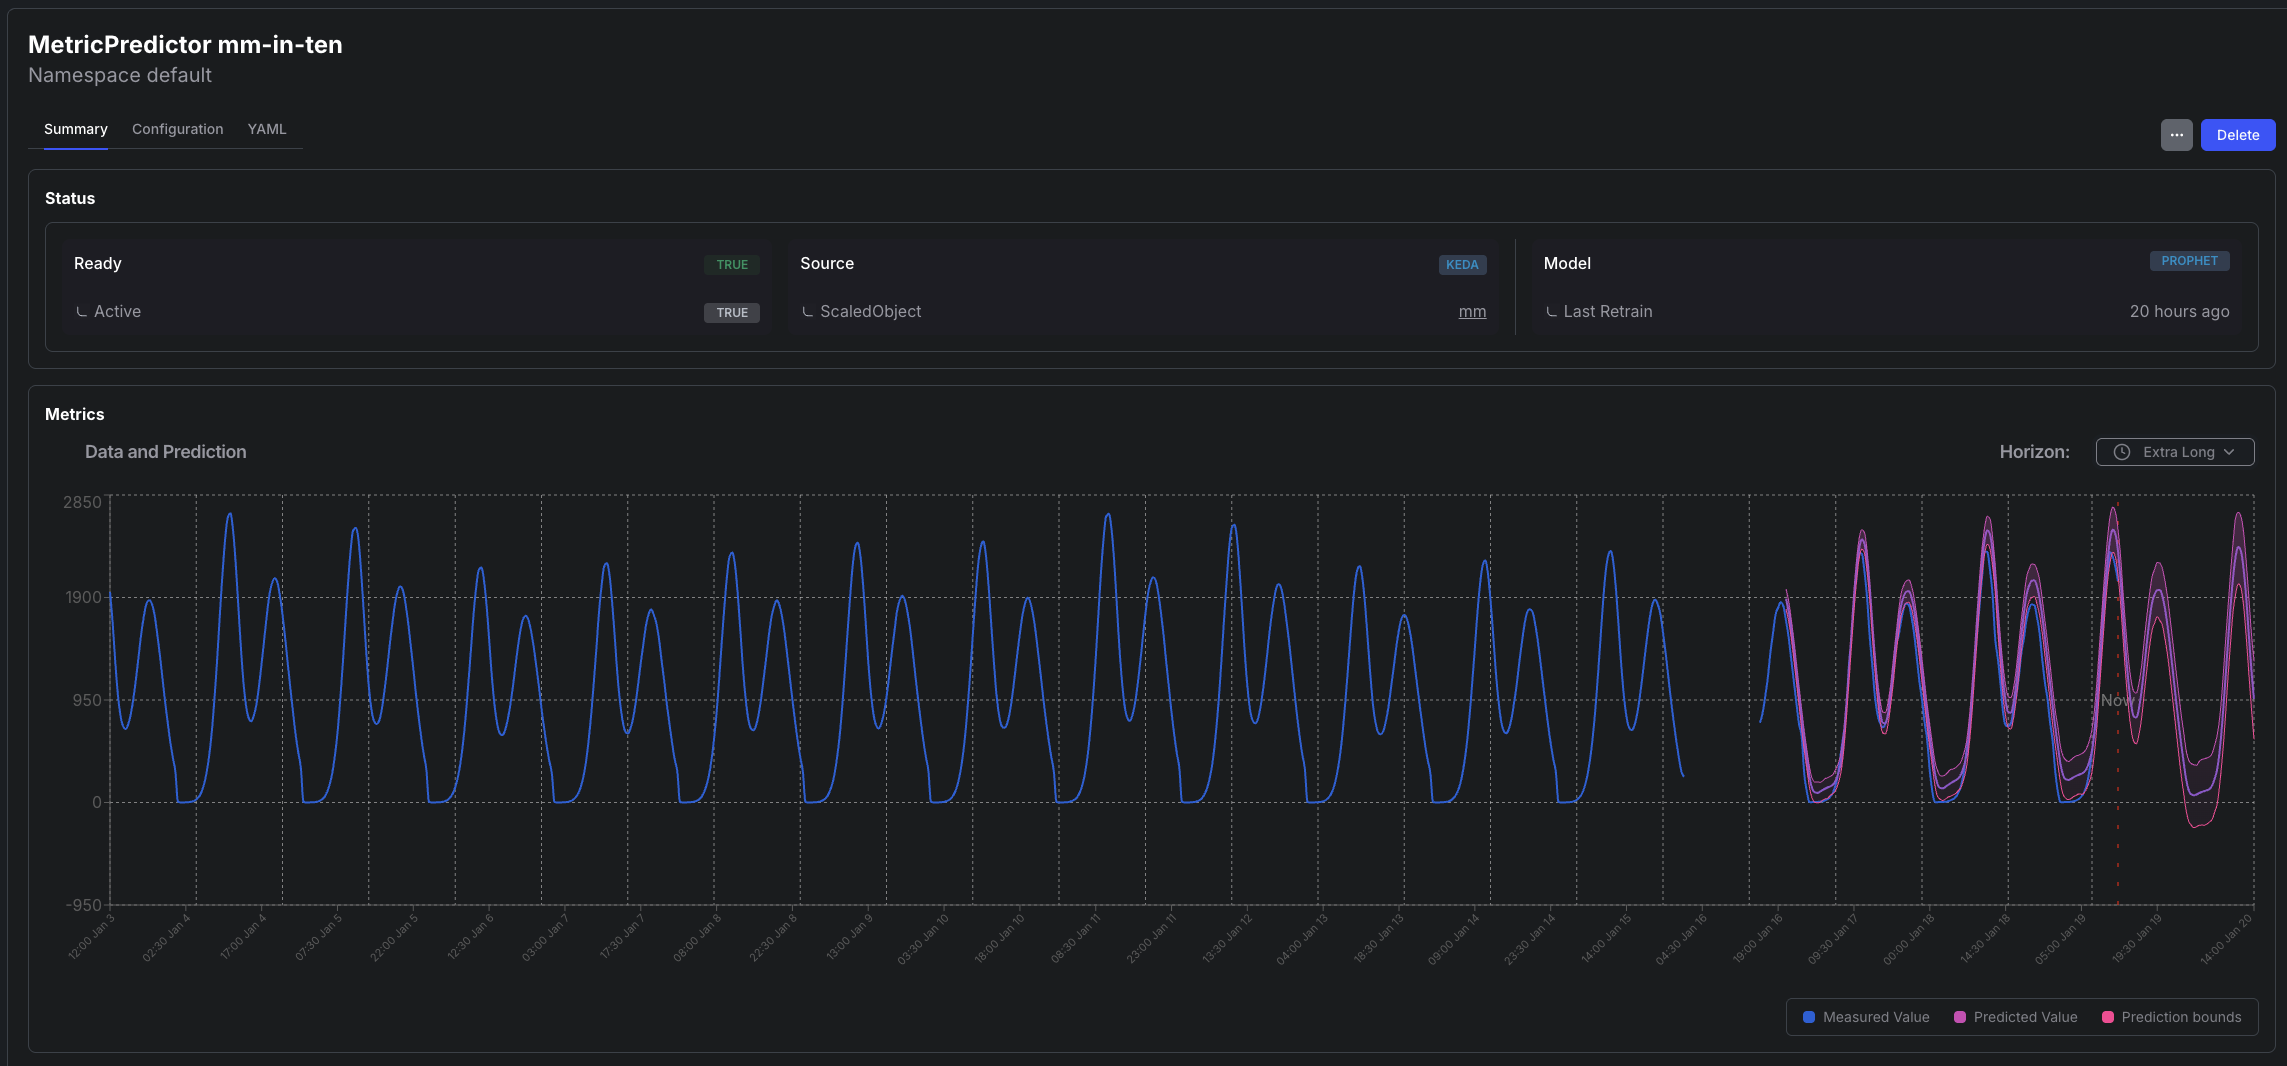
or using the Kedify Dashboard
5. Start Using the Model for Predictions
Section titled “5. Start Using the Model for Predictions”To do that, modify the existing ScaledObject and add the predictive trigger. This ScaledObject also uses scaling modifiers to blend the two values (predicted one and the real one) together.
apiVersion: keda.sh/v1alpha1kind: ScaledObjectmetadata: name: mm namespace: defaultspec: scaleTargetRef: name: podinfo pollingInterval: 10 cooldownPeriod: 5 minReplicaCount: 0 maxReplicaCount: 6 advanced: scalingModifiers: formula: "(mm + mmInTenMinutes)/2" target: "400" metricType: "AverageValue" horizontalPodAutoscalerConfig: behavior: scaleUp: stabilizationWindowSeconds: 0 scaleDown: stabilizationWindowSeconds: 0 triggers: - type: metrics-api name: mm metadata: url: "http://mm.default.svc.cluster.local/api/v1/minutemetrics" valueLocation: "value" targetValue: "400" - type: kedify-predictive name: mmInTenMinutes metadata: modelName: mm-in-ten targetValue: "400"Conclusion
Section titled “Conclusion”- We have set up a demo application that is first scaled by a common ScaledObject.
- By creating the MetricPredictor resource, we make sure the predictor starts receiving the metrics used by KEDA for scaling and capturing them.
- Kedify prediction controller periodically trains the model using those metrics.
- Once we are happy with the model, we can use it either from the original scaler or any other KEDA ScaledObject or ScaledJob for driving the scaling decision.