
Envoy HTTP scaler
Kedify Envoy HTTP Scaler ensures that your service scales based on incoming HTTP requests using a custom Envoy proxy. To use this scaler, an existing Envoy proxy is required in your environment and needs to be configured to send metrics to Kedify Scaler.
Details
Section titled “Details”The kedify-envoy-http scaler is designed specifically for ScaledObject resources to enable scaling based on incoming HTTP traffic using a custom Envoy proxy. Unlike kedify-http, it does not support scaling to zero, as Envoy cannot hold traffic during scale-to-zero scenarios. The scaler monitors traffic using the custom Envoy proxy and routes traffic accordingly.
With this scaler, users can define specific metrics, such as request rate or concurrency, to determine the scaling needs of the application, ensuring optimal performance and resource utilization.
Architecture
Section titled “Architecture”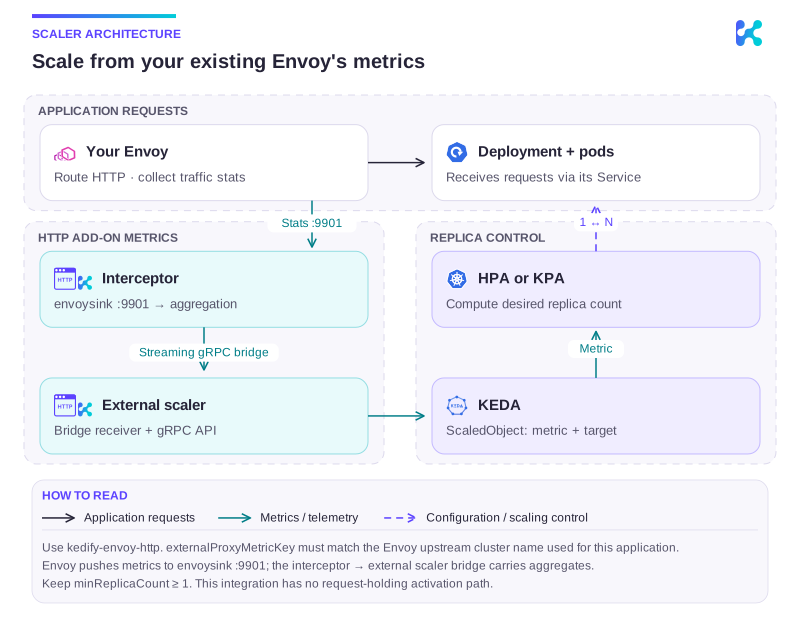
Diagram description
An existing Envoy routes HTTP requests to the application Service and pushes request-rate/concurrency statistics to the interceptor envoysink on gRPC port 9901. Aggregates stream to the external scaler over its bridge. KEDA supplies metrics to HPA or KPA, which changes the Deployment's replicas. This integration does not support scale-to-zero; minReplicaCount must be at least one.
Trigger Specification
Section titled “Trigger Specification”See HTTP scaler and inference configuration for the trigger fields.
Example ScaledObject with Kedify Envoy HTTP Trigger
Section titled “Example ScaledObject with Kedify Envoy HTTP Trigger”Here is a full example of a ScaledObject definition using the Kedify Envoy HTTP trigger:
apiVersion: keda.sh/v1alpha1kind: ScaledObjectmetadata: name: app-envoyspec: scaleTargetRef: apiVersion: apps/v1 kind: Deployment name: app-1 cooldownPeriod: 5 minReplicaCount: 1 maxReplicaCount: 10 triggers: - type: kedify-envoy-http metadata: scalingMetric: requestRate targetValue: "10" granularity: "1s" window: "1m0s" externalProxyMetricKey: "my_app_com"Configuring Existing Envoy Proxy
Section titled “Configuring Existing Envoy Proxy”The Kedify Envoy HTTP Scaler uses Envoy to route traffic and collect metrics for applications to improve reliability and performance. This setup prevents situations where the interceptor may become a bottleneck. Standard reverse proxies, such as Envoy, nginx, or HAProxy, are better equipped to handle such conditions.
To route application traffic through a custom Envoy and enable it to flush metrics to KEDA for scaling, add the following configuration snippet within your Envoy fleet. This configuration ensures that metrics are pushed to the interceptor every second, complete with all necessary labels and values for HTTP-based scaling.
stats_flush_interval: 1sstats_sinks: - name: kedify_metrics_sink typed_config: "@type": type.googleapis.com/envoy.config.metrics.v3.MetricsServiceConfig transport_api_version: V3 report_counters_as_deltas: true emit_tags_as_labels: true grpc_service: envoy_grpc: cluster_name: kedify_metrics_service retry_policy: retry_back_off: base_interval: 0.5s max_interval: 5s num_retries: 100 retry_on: connect-failureAlso, add the kedify_metrics_service cluster to your static_resources:
static_resources: clusters: - name: kedify_metrics_service connect_timeout: 2s type: STRICT_DNS lb_policy: ROUND_ROBIN typed_extension_protocol_options: envoy.extensions.upstreams.http.v3.HttpProtocolOptions: "@type": type.googleapis.com/envoy.extensions.upstreams.http.v3.HttpProtocolOptions explicit_http_config: http2_protocol_options: {} load_assignment: cluster_name: kedify_metrics_service endpoints: - lb_endpoints: - endpoint: address: socket_address: address: keda-add-ons-http-interceptor-kedify-proxy-metric-sink.keda port_value: 9901This utilizes the stats_sink extension, implementing the V3 gRPC MetricsService. For each scaled application where these Envoy metrics should be aggregated with the internal interceptor metrics, you should configure externalProxyMetricKey in the trigger metadata:
triggers: - type: kedify-envoy-http metadata: scalingMetric: requestRate targetValue: "10" granularity: "1s" window: "1m0s" externalProxyMetricKey: "my_app_com"Here, my_app_com refers to the upstream cluster_name from the Envoy configuration used to route the traffic to the desired application. Depending on your Envoy config, the section may look similar to this:
static_resources: listeners: - filter_chains: - filters: - name: envoy.filters.network.http_connection_manager typed_config: "@type": type.googleapis.com/envoy.extensions.filters.network.http_connection_manager.v3.HttpConnectionManager route_config: virtual_hosts: - domains: ["www.my-app.com"] routes: - match: prefix: "/" route: cluster: my_app_com # <-- cluster_name from virtual_host auto_host_rewrite: false clusters: - name: my_app_com # <-- matching cluster_name upstreamThe two Envoy metrics that are ingested and processed are:
cluster.upstream_rq_total- for the request rate scaling metriccluster.upstream_rq_active- for the concurrency scaling metric
Continue with this topic
Section titled “Continue with this topic”Diagnose: Workload does not scale, or scales too slowly.
Related capabilities: HTTP scaling.