Insights
Kedify Insights turns monitored pod utilization into CPU and memory recommendations for Kubernetes workloads. Use it to find requests and limits that are higher than recent usage, then review and apply the change from the dashboard or with the generated kubectl command.
What Insights Shows
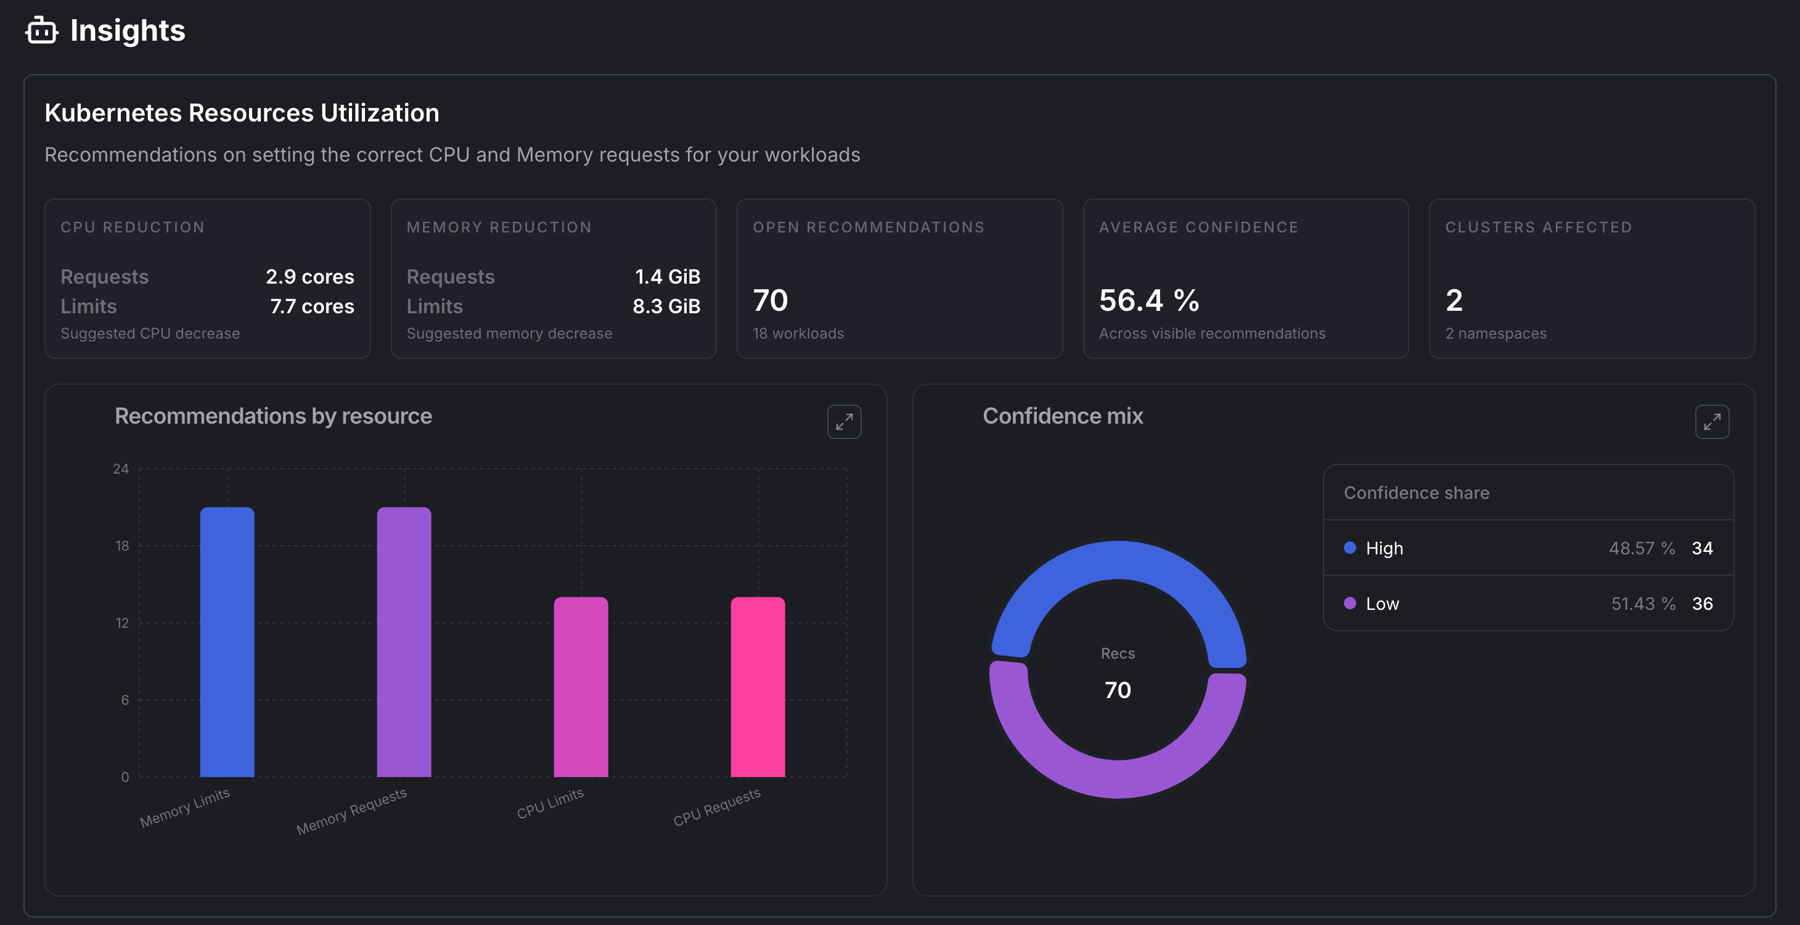
Section titled “What Insights Shows”The organization view summarizes recommendations across clusters. Use it to see total CPU and memory reduction, open recommendations, average confidence, and which clusters have affected workloads. The cluster view narrows the same information to one cluster and adds namespace monitoring controls.
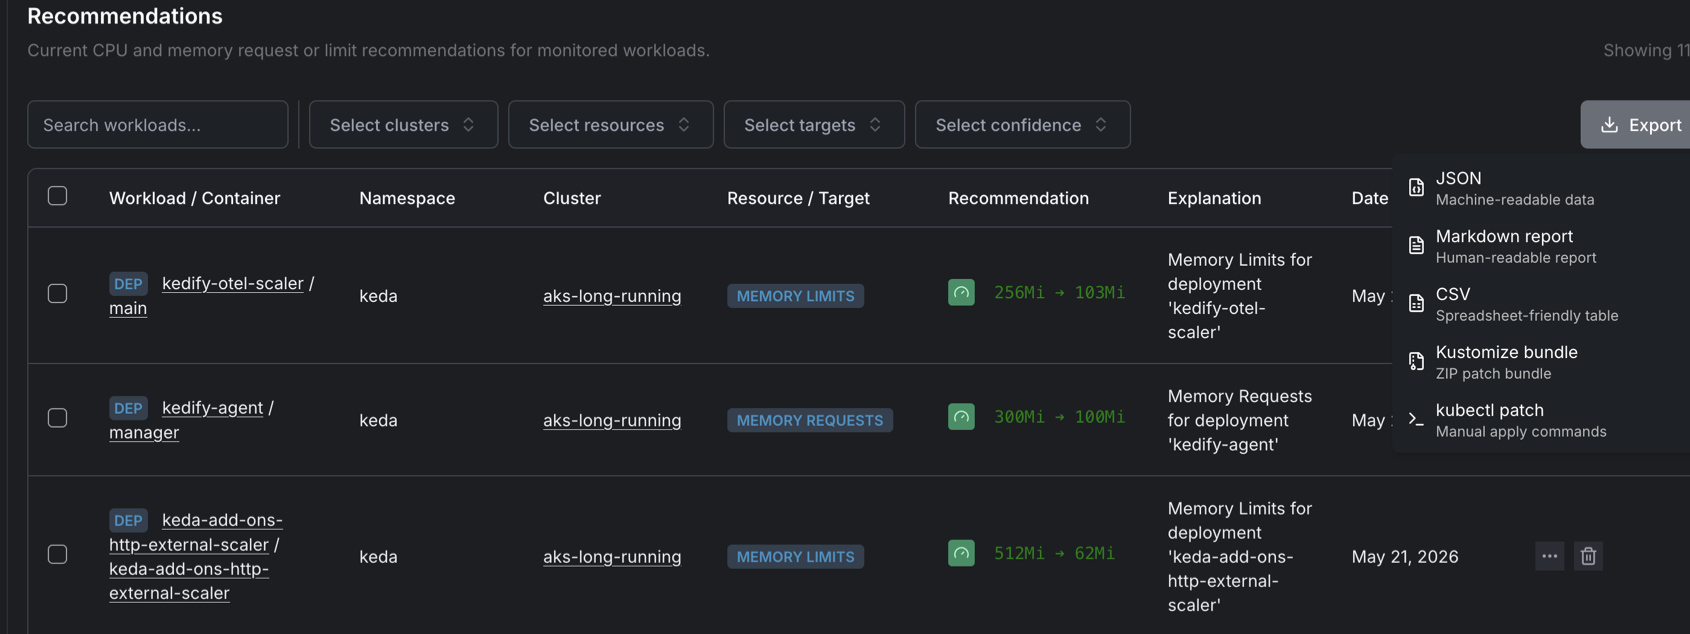
Each recommendation includes:
- workload and container
- namespace, cluster, and workload kind
- resource target: CPU or memory, requests or limits
- current value, recommended value, confidence, and recommendation date
- an explanation and a manual
kubectl set resourcescommand
Monitoring Scope
Section titled “Monitoring Scope”Insights only evaluates namespaces selected for monitoring. In the cluster Insights page, use Configure to start or stop monitoring for namespaces. Kedify labels monitored namespaces with insights.kedify.io/scrape=true.
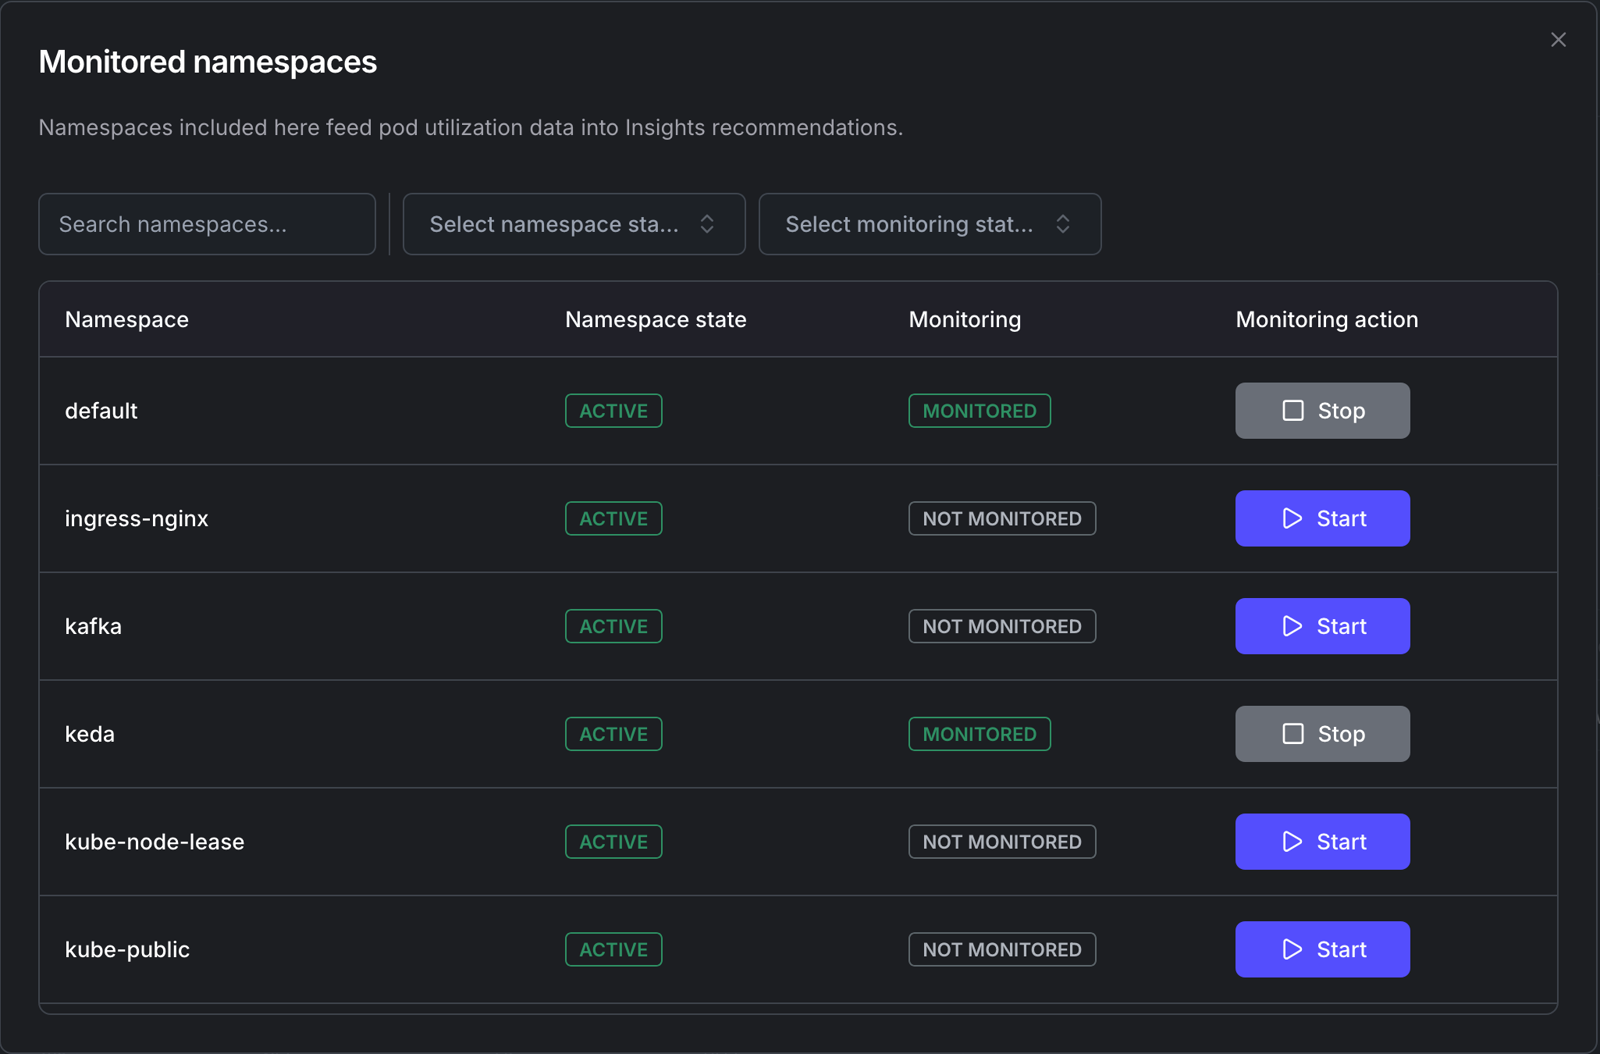
New recommendations are not instant. Kedify needs recent utilization samples before it can calculate suggestions; one hour is the minimum, and confidence improves as more history is available.
Reviewing Recommendations
Section titled “Reviewing Recommendations”Open a recommendation to see the measured value, suggested value, confidence, time interval, and the command that would apply the change manually.
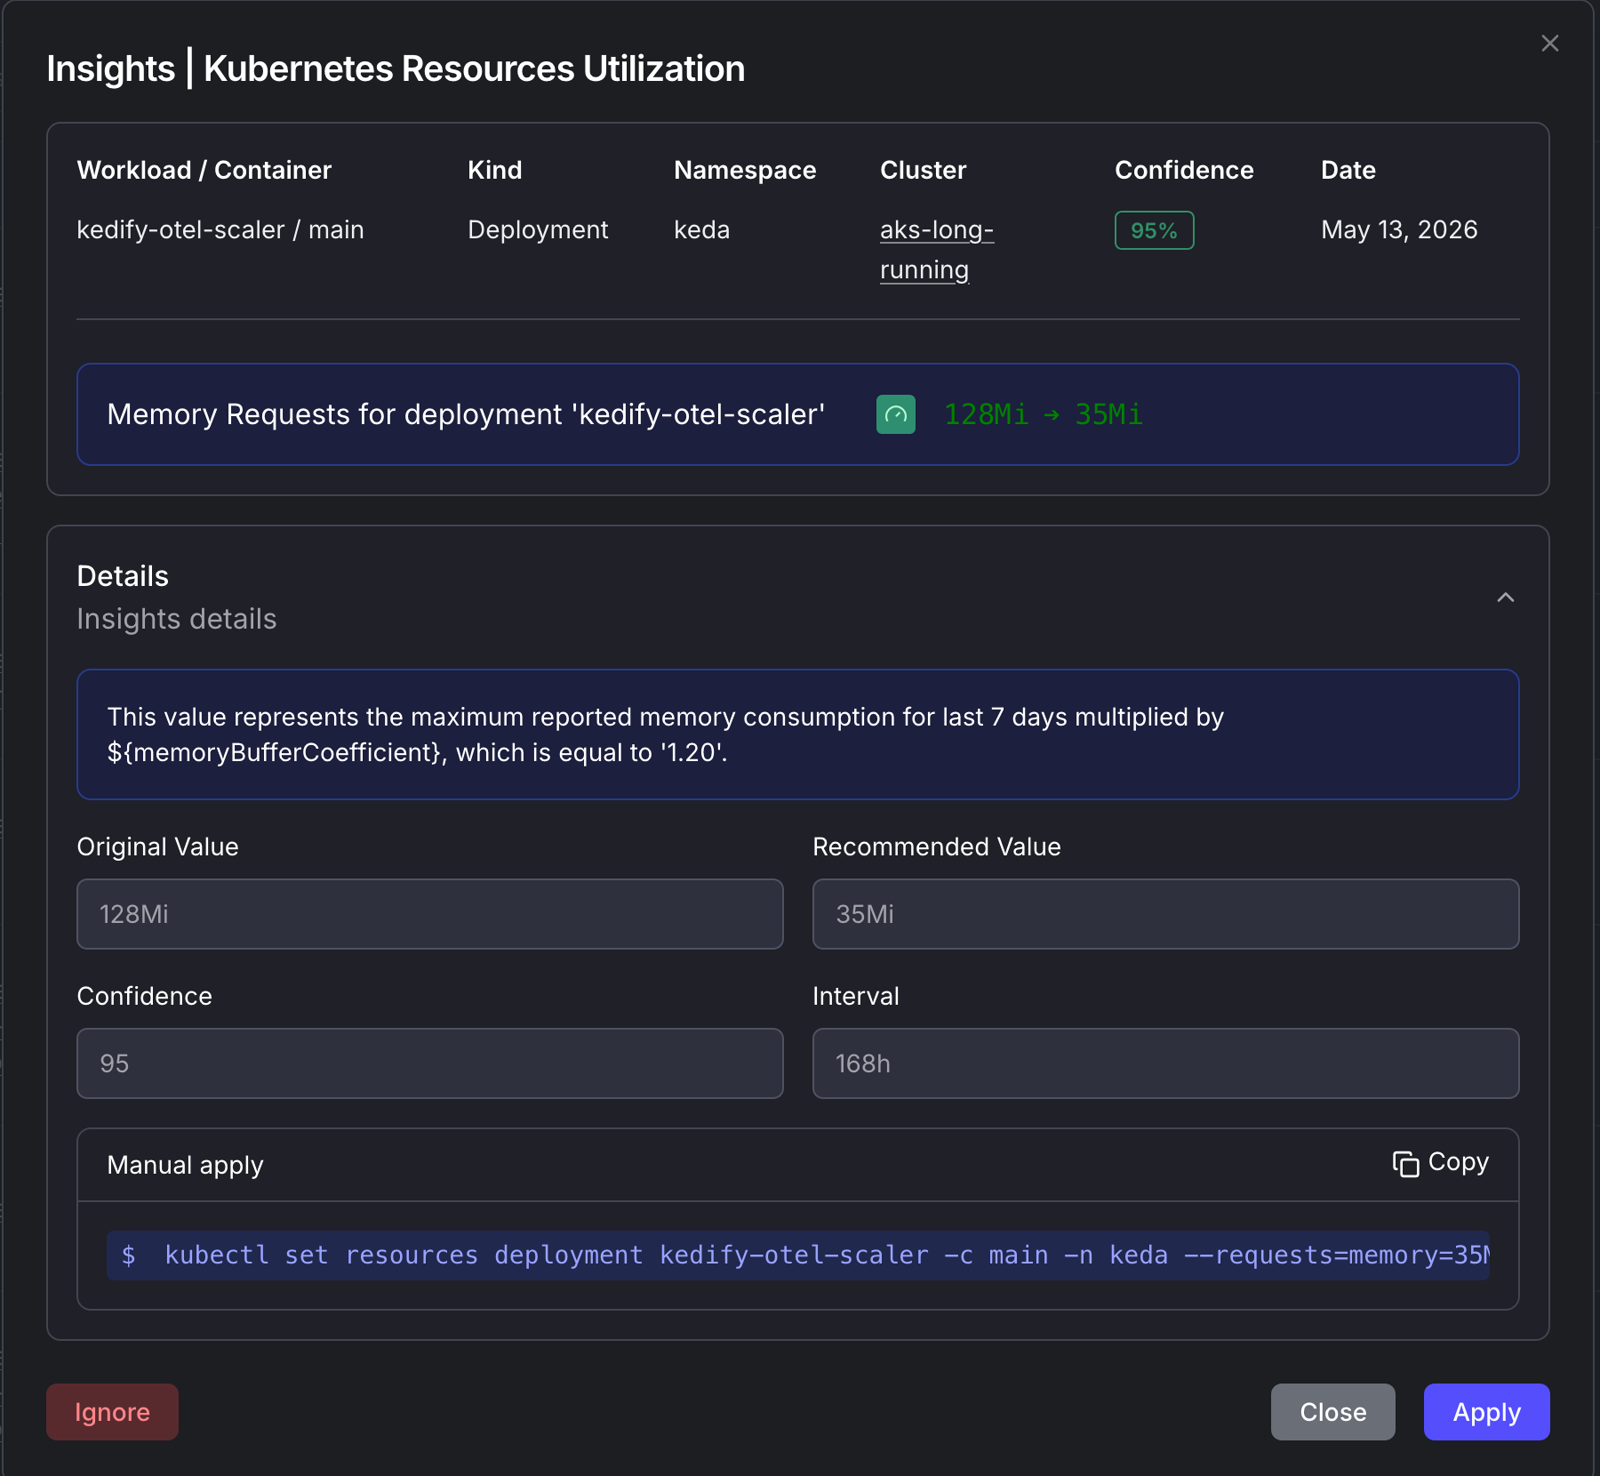
When you apply a recommendation from the dashboard, Kedify updates the target Deployment or StatefulSet resource. For managed KEDA components, the dashboard updates the relevant Helm values instead. You can also ignore a recommendation when it is not useful for the workload.
Exporting Recommendations
Section titled “Exporting Recommendations”Use Export on the recommendations table to download the current filtered list or selected recommendations. Exports are available as JSON, Markdown, CSV, a Kustomize ZIP bundle, or a kubectl command script.