
Tune Kedify Proxy performance
Tune proxy capacity against measured request concurrency, payload size, response latency and memory use. Record the installed Agent, HTTP Add-on and Proxy versions before changing values; repeat the same load test after each change.
Step 4: Optimize Proxy Configuration
Section titled “Step 4: Optimize Proxy Configuration”Resource requests and limits
Section titled “Resource requests and limits”Adjust Kedify Proxy resource requests and limits based on your application’s needs. Depending on your installation method, you may need to adjust the resource requests and limits in either the Agent or the Kedify Proxy helm chart.
Values used by all instances of Kedify Proxy across all namespaces are defined in the globalValues section of the Agent helm chart. The following example shows how to set resource requests and limits for Kedify Proxy in the Agent helm chart:
agent: kedifyProxy: globalValues: resources: requests: cpu: 100m memory: 128Mi limits: cpu: 200m memory: 256MiTo adjust the resource requests and limits for a Kedify Proxy in a specific namespace, you can use the namespacedValues section of the Agent helm chart:
agent: kedifyProxy: namespacedValues: namespace1: resources: requests: cpu: 100m memory: 128Mi limits: cpu: 200m memory: 256MiIf you are installing Kedify Proxy as a standalone service, you can adjust the resource requests and limits in the Kedify Proxy helm chart:
resources: requests: cpu: 100m memory: 128Mi limits: cpu: 200m memory: 256MiTimeouts
Section titled “Timeouts”The HTTP Add-on chart 0.15.0 exposes separate interceptor deadlines. These are the chart’s documented code defaults when values are unset, not a universal timeout for every Envoy or client connection:
| Helm value | Default | Scope |
|---|---|---|
interceptor.tcpConnectTimeout | 500ms | One TCP connection attempt to the backend |
interceptor.responseHeaderTimeout | 300s | Waiting for backend response headers |
interceptor.readinessTimeout | Disabled | Waiting for ready backend capacity, including activation from zero |
interceptor.requestTimeout | Disabled | Total request lifecycle |
Set an explicit readiness budget based on measured node provisioning, image pull and model/application startup. Client, ingress and Envoy route deadlines can expire first. Example override, not a default:
interceptor: readinessTimeout: "120s"interceptor.replicas.waitTimeout is deprecated in this chart; use readinessTimeout. Check the values for your installed release before migrating an older configuration.
Graceful Termination
Section titled “Graceful Termination”When Kedify Proxy scales in or one of its pods is getting evicted to a new node, it uses preStop hook to gracefully terminate and let all active HTTP connections to complete. During this time, Kedify Proxy will not accept new connections, and the hook waits for
http.kedify-proxy.downstream_cx_active metric to report 0. The default timeout for the hook is 30 seconds with 5 seconds as an additional buffer after all connections are already drained. You can adjust this through kedify-agent helm chart:
agent: kedifyProxy: globalValues: pod: preStopHookWaitSeconds: 2 # <- additional short timeout after all connections are drained terminationGracePeriodSeconds: 60 # <- total timeout for the preStop hook namespacedValues: default: pod: preStopHookWaitSeconds: 3 # <- additional short timeout after all connections are drained in default namespace terminationGracePeriodSeconds: 90 # <- total timeout for the preStop hook in default namespaceThe terminationGracePeriodSeconds should be equal or larger than the response time of your application. If the pod reaches this deadline, Kubernetes can kill it with requests still in flight. Clients may observe a reset, timeout or gateway error; do not rely on a specific HTTP status.
Circuit Breaker
Section titled “Circuit Breaker”Envoy has a built-in circuit breaker that can help prevent cascading failures in your application. But when set too low, it can create a bottleneck in your environment. You can configure the circuit breaker in the Kedify HTTP Addon helm chart:
interceptor: envoy: upstreamRateLimiting: maxConnections: 8192 maxRequests: 8192 maxPendingRequests: 8192 maxRetries: 3Overload Manager
Section titled “Overload Manager”Envoy has a built-in overload manager that can help prevent resource exhaustion during high traffic periods. But when set too low, it can create a bottleneck in your environment. You can configure the overload manager in the Kedify Proxy helm chart:
config: overloadManager: enabled: true refreshInterval: 0.25s maxActiveDownstreamConnections: 10000Step 5: Autoscale Kedify Proxy
Section titled “Step 5: Autoscale Kedify Proxy”Kedify Proxy can also be autoscaled and help your infrastructure during high load periods. The following example shows how to configure autoscaling for Kedify Proxy in the Kedify Proxy helm chart:
autoscaling: enabled: true minReplicaCount: 1 maxReplicaCount: 10Step 6: Monitor Performance
Section titled “Step 6: Monitor Performance”Envoy provides a variety of metrics that can help you monitor the performance of your autoscaling setup. These metrics can be accessed through the Envoy admin interface. Typically on port 9901/admin of the Kedify Proxy pod. You can also use a ServiceMonitor to scrape these metrics and send them to a monitoring system like Prometheus. The following example shows how to create a ServiceMonitor for an example Kedify Proxy in namespace http-server:
apiVersion: monitoring.coreos.com/v1kind: ServiceMonitormetadata: name: kedify-http-proxyspec: endpoints: - port: admin scheme: http path: /stats/prometheus namespaceSelector: matchNames: - http-server selector: matchLabels: app: kedify-proxyStep 7: How we perform load testing at Kedify
Section titled “Step 7: How we perform load testing at Kedify”We use load testing tool Locust to perform load testing on Kedify Proxy. Locust is a powerful and flexible load testing tool that allows us to simulate a large number of users and http requests to the proxy and the http application that is being scaled by Kedify.
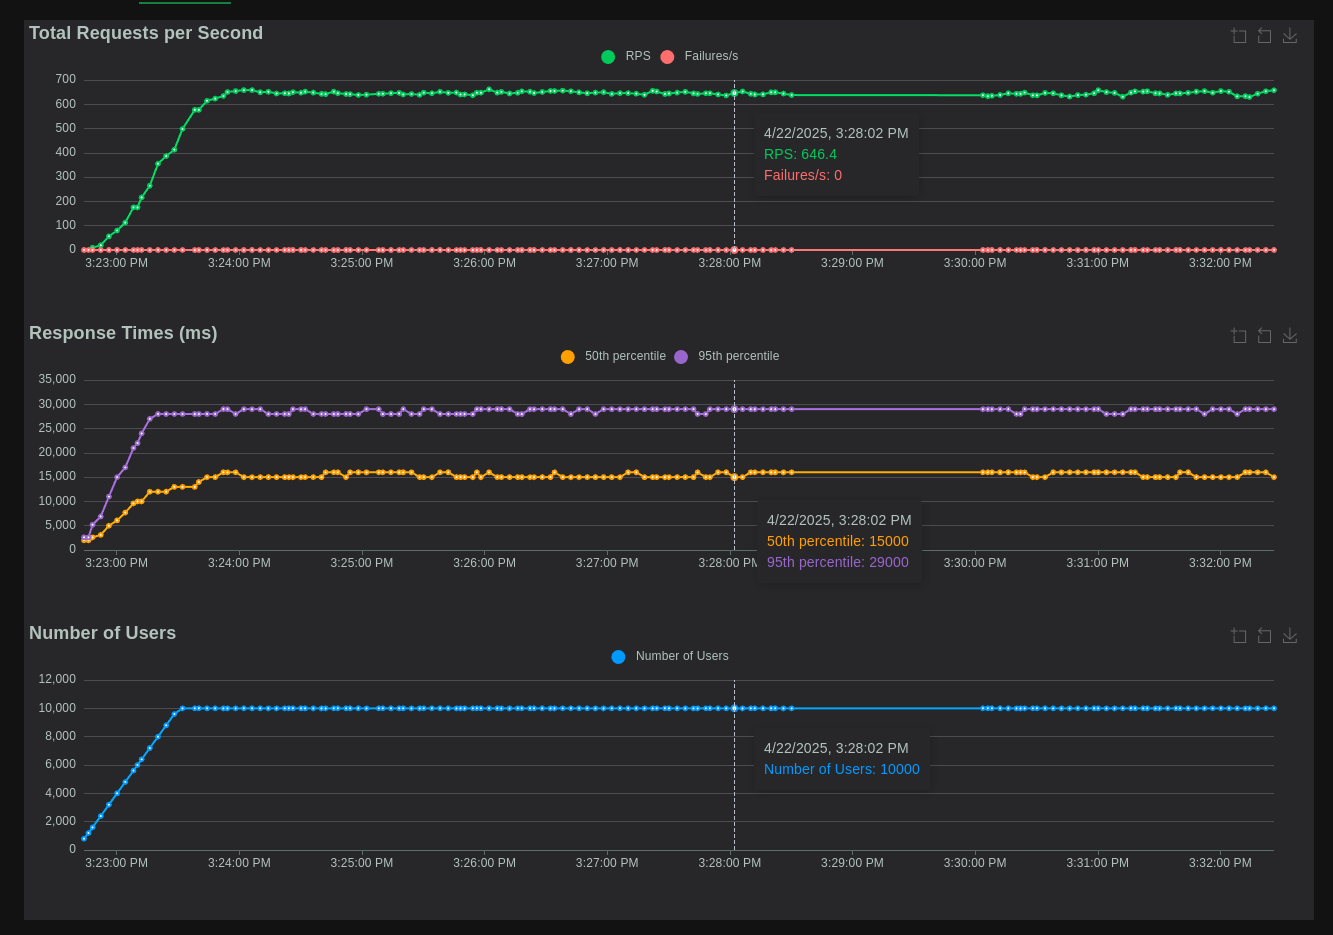
We combine statistics provided by Locust with metrics collected from Envoy and our http application. We assume that the application runs intensive calculations or waits for other services to respond. We simulate this by using a delay in the application’s response that is randomly chosen between 1 and 30 seconds. With this assumption, we expect to see the 50th percentile of the response time to be around 15 seconds and the 95th percentile to be around 29 seconds. With thousands of clients that try to connect to the application, we set the maximum number of potential application replicas to 10 and the requests per second scaling metric to a relatively low value, we use a range between 10 and 100, so that Kedify can add new application pods aggressively, as new requests are coming in. Kedify Proxy autoscaling is enabled and the maximum number of replicas is set to 10. This way we want to take the advantage of horizontal scaling to spread the load. With this high number of clients, but very limited throughput, Kedify Proxy pods cache a lot of requests and send them to the application when available.
With many concurrent clients and slow responses, queued requests can increase proxy memory even while CPU use remains low. Monitor upstream_rq_pending_active for current queue depth and the rate of change of upstream_rq_pending_total for newly queued requests. upstream_rq_pending_total is a cumulative counter: a nonzero value alone does not show current overload. Correlate queue growth with overflow/error counters, ready replicas and application latency before raising limits. See the Envoy cluster statistics definitions.
Next steps
Section titled “Next steps”Repeat the same load profile after changing one setting. Compare successful throughput, tail latency, pending requests, errors and proxy memory. Restore the previous values if the change worsens these results.
Continue with this topic
Section titled “Continue with this topic”Reference: Kedify Proxy Envoy configuration · HTTP scaler and inference configuration.
Related capabilities: Diagnose HTTP requests with logs and error metrics · Prepare workloads for reliable autoscaling.