
Test automatic rightsizing with PRA
This guide demonstrates vertical scaling with PodResourceAutoscaler (PRA).
For reproducibility it uses Kedify’s load-generator sample app as the workload driver, but the same setup applies to your own applications.
Prerequisites
Section titled “Prerequisites”- A running Kubernetes cluster.
- The
kubectlcommand-line utility installed and accessible. - Connect your cluster in the Kedify Dashboard.
- If you do not have a connected cluster, see installation documentation.
- Kedify Agent installed with Pod Resource Autoscaler feature enabled:
agent.features.podResourceAutoscalersEnabled=true- Installed Agent version:
v0.4.14or later (see Versions & Compatibility).
- Kubernetes support for in-place pod resize.
- This is enabled by default in Kubernetes
v1.33+. - If using an older cluster, enable the
InPlacePodVerticalScalingfeature gate.
- This is enabled by default in Kubernetes
Step 1: Deploy the Example Workload
Section titled “Step 1: Deploy the Example Workload”This guide uses Kedify’s sample load-generator application.
Source code: https://github.com/kedify/examples/tree/main/samples/load-generator
Apply the following Deployment and Service:
cat <<EOF | kubectl apply -f -apiVersion: apps/v1kind: Deploymentmetadata: name: load-generator labels: app: load-generatorspec: replicas: 1 selector: matchLabels: app: load-generator template: metadata: labels: app: load-generator annotations: pra.kedify.io/reconcile: enabled spec: containers: - name: load-generator image: ghcr.io/kedify/sample-load-generator:latest imagePullPolicy: Always ports: - containerPort: 8080 name: http env: - name: BASELINE_CPU_MILLICORES value: "100" - name: BASELINE_MEMORY_MIB value: "96" resources: requests: cpu: 100m memory: 96Mi limits: cpu: 300m memory: 600Mi readinessProbe: httpGet: path: /healthz port: http periodSeconds: 5 livenessProbe: httpGet: path: /healthz port: http initialDelaySeconds: 5 periodSeconds: 10---apiVersion: v1kind: Servicemetadata: name: load-generator labels: app: load-generatorspec: type: ClusterIP ports: - name: http port: 8080 targetPort: http selector: app: load-generatorEOFVerify the Pod is ready:
kubectl rollout status deploy/load-generatorStep 2: Create PodResourceAutoscaler
Section titled “Step 2: Create PodResourceAutoscaler”Apply PRA configuration that manages both CPU and memory requests/limits:
cat <<EOF | kubectl apply -f -apiVersion: keda.kedify.io/v1alpha1kind: PodResourceAutoscalermetadata: name: load-generatorspec: target: kind: deployment name: load-generator containerName: load-generator policy: pollInterval: 5s consecutiveSamples: 2 cooldown: 30s after: containerReady delay: 5s cpu: requests: scaleUpThreshold: 75 scaleDownThreshold: 45 targetUtilization: 60 limits: scaleUpThreshold: 85 scaleDownThreshold: 60 targetUtilization: 70 memory: requests: scaleUpThreshold: 75 scaleDownThreshold: 50 targetUtilization: 60 limits: scaleUpThreshold: 85 scaleDownThreshold: 60 targetUtilization: 70 bounds: cpu: requests: min: 100m max: "2" step: 200m stepPercent: 50 limits: min: 300m max: "3" step: 300m stepPercent: 50 memory: requests: min: 96Mi max: 2Gi step: 128Mi stepPercent: 50 limits: min: 600Mi max: 3Gi step: 256Mi stepPercent: 50EOFStep 3: Watch In-Place Resource Resizing
Section titled “Step 3: Watch In-Place Resource Resizing”Open a terminal and watch container resources:
watch "kubectl get pod -l app=load-generator -ojsonpath=\"{.items[0].spec.containers[?(.name=='load-generator')].resources}\" | jq"You should see similar output:
{ "limits": { "cpu": "300m", "memory": "600Mi" }, "requests": { "cpu": "169m", "memory": "196Mi" }}Step 4: Change Runtime Load Profiles
Section titled “Step 4: Change Runtime Load Profiles”Start port-forward in another terminal:
kubectl port-forward svc/load-generator 8080:8080Set workload to idle (low footprint) first:
curl -s -X POST localhost:8080/profile/idle | jqCheck current profile:
curl -s localhost:8080/status | jqYou should see similar output:
{ "baseline": { "cpuMillicores": 100, "memoryMiB": 96 }, "desired": { "cpuMillicores": 100, "memoryMiB": 96 }, "current": { "cpuMillicores": 100, "memoryMiB": 96 }, "activeProfile": "idle", "schedule": { "active": false }, "cpu": { "workers": 2, "targetMillicores": 100, "maxMillicores": 2000, "requestedMillicores": 100 }, "memory": { "targetMiB": 96, "allocatedMiB": 96 }, "uptimeSeconds": 26676}Trigger higher load:
curl -s -X POST localhost:8080/profile/high | jqVerify in the watch output from Step 3 that requests/limits go up.
Then return to idle:
curl -s -X POST localhost:8080/profile/idle | jqVerify in the watch output that requests/limits go down again.
Replica count should remain 1 for the whole flow.
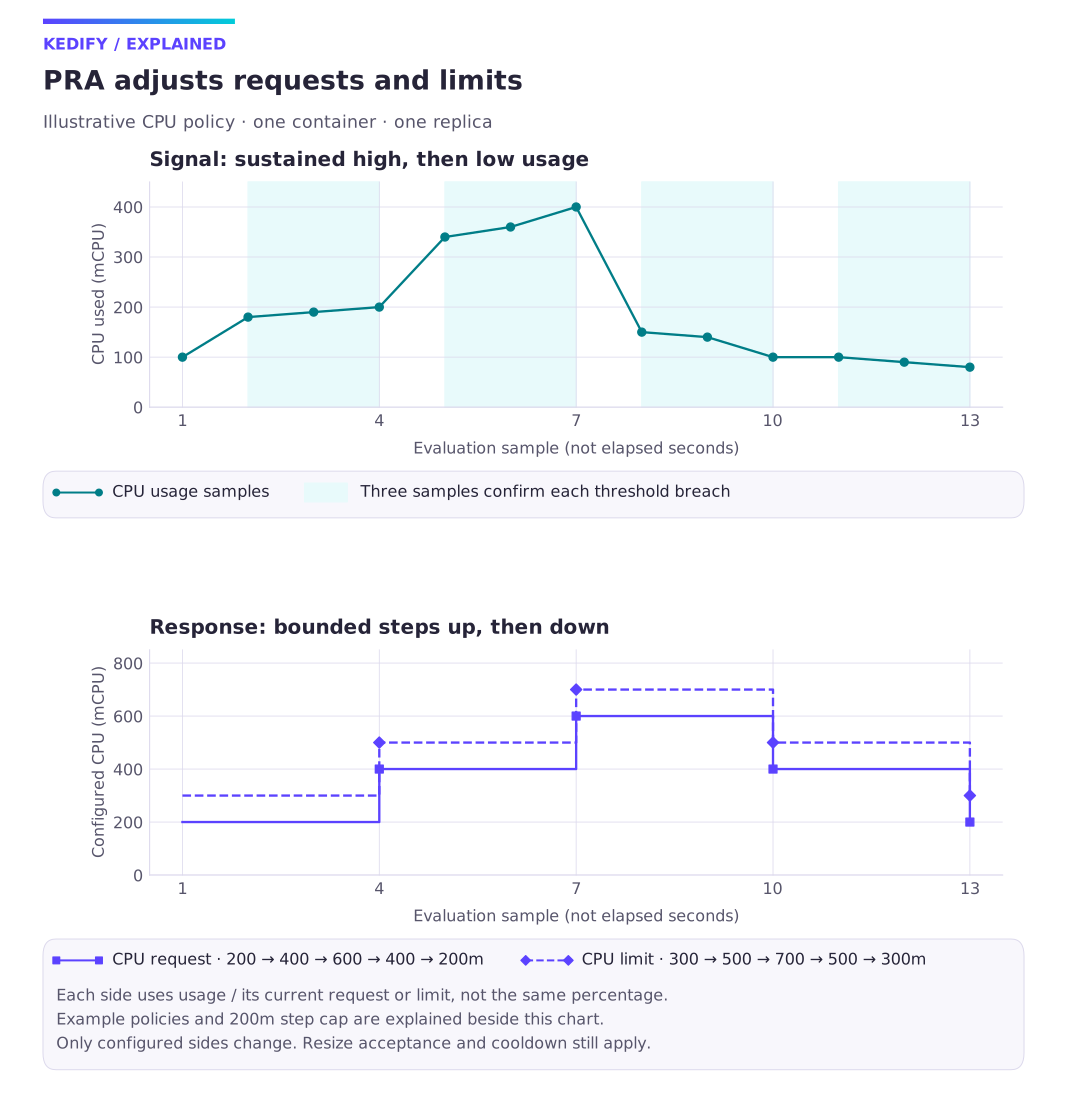
Diagram description
Illustrative CPU usage rises then falls. After three qualifying samples, CPU requests change from 200 to 400 to 600 to 400 to 200m, and limits from 300 to 500 to 700 to 500 to 300m. Each side has its own utilization policy. Changes are capped at 200m; replicas remain at one.
This uses the separate illustrative CPU policy, not captured output or the exact configuration from this tutorial. Compare your observed samples, resize events and actual resources; the elapsed time and values depend on your policy and cluster.
Step 5: Verify PRA Status and Events
Section titled “Step 5: Verify PRA Status and Events”Check PRA status and latest scaling action:
kubectl describe pra load-generatorkubectl get pra load-generator -o jsonpath='{.status.lastScaleAction}{"\n"}{.status.lastScaleResourceChange}{"\n"}'Inspect related Kubernetes events:
kubectl get events --sort-by=.lastTimestamp | grep PodResourceAutoscalerYou should see events similar to PodResourceAutoscalerScaleUp and PodResourceAutoscalerScaleDown.
Cleanup
Section titled “Cleanup”kubectl delete pra load-generatorkubectl delete svc load-generatorkubectl delete deploy load-generatorContinue with this topic
Section titled “Continue with this topic”Configure and verify: Diagnose resize failures.
Reference: PodResourceAutoscaler API reference.
Diagnose: Pod resources do not resize as expected.
Related capabilities: Pod Resource Autoscaler (PRA).