
Autoscaler Performance & Tuning
This benchmark measures how long a real scale action takes as one Kubernetes cluster grows from 100 to 5,000 scaled applications. It compares KEDA-generated native HPAs, one cluster-wide Kedify Pod Autoscaler (KPA), and ten tenant KEDA + KPA shards.
The result is a capacity-planning pattern, not a universal sizing guarantee: raising one controller’s Kubernetes API client request rate moves the limit, while sharding keeps each controller’s ownership set bounded.
What was compared
Section titled “What was compared”| Layout | Controller ownership | External metric path |
|---|---|---|
| Native HPA | One cluster HPA controller; one KEDA installation creates the HPAs and serves their metrics | external.metrics.k8s.io through the KEDA metrics API server |
| Single KPA | One KPA and one KEDA installation own every workload | KPA reads from its paired KEDA operator over gRPC |
| Multi-tenant KPA | Ten KEDA + KPA pairs; each owns about one tenth of the population | Each KPA reads from the KEDA operator in its shard |
“Native HPA” means an HPA generated by KEDA and driven by an external metric. It is the realistic baseline for event-driven KEDA workloads, not a hand-authored CPU HPA.
The reported cohort used one shared external metric so every workload received the same synchronized change. It contained about 88% of the generated population: 4,400 of 5,000 objects in the largest run. Using the same cohort for every table keeps the HPA and KPA paths comparable.
Two intervals are reported:
- Warm decision: synchronized metric change to the autoscaler’s
lastScaleTime, with every autoscaler already present. - Cold fan-out: each
ScaledObjectcreation timestamp to its firstlastScaleTime, after creating the full population at once.
Both stop at the scale action and exclude pod scheduling and readiness.
Warm decision latency
Section titled “Warm decision latency”An uncongested controller cannot beat its evaluation interval. With a 15-second sync period and workloads at different points in that cycle, the expected floor is about 7.5 seconds at p50 and 15 seconds at p99.
The chart shows the median trend. The table reports seconds added above the expected sync floor across p50, p95, and p99.
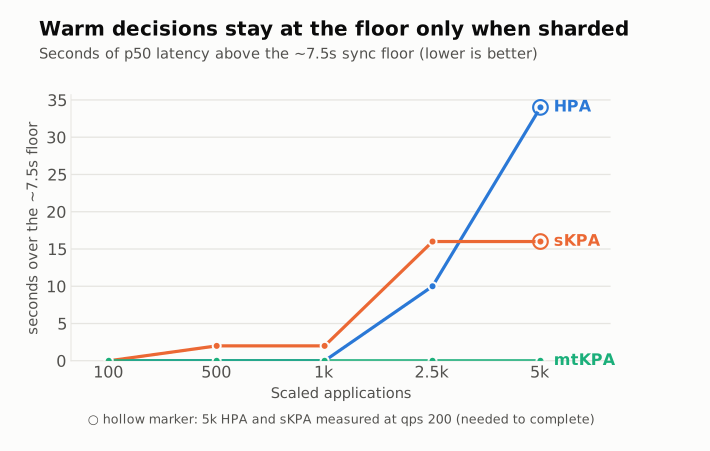
Diagram description
Published p50 excess latency for HPA, one KPA, and ten KPA shards.
| Applications | Native HPA | Single KPA | 10 KPA shards | ||||||
|---|---|---|---|---|---|---|---|---|---|
| p50 | p95 | p99 | p50 | p95 | p99 | p50 | p95 | p99 | |
| 100 | <1s | <1s | <1s | <1s | <1s | <1s | <1s | <1s | <1s |
| 500 | <1s | <1s | <1s | +2s | +1s | <1s | <1s | <1s | <1s |
| 1,000 | <1s | <1s | <1s | +2s | +2s | +1s | <1s | +1s | <1s |
| 2,500 | +10s | +20s | +19s | +16s | +30s | +31s | <1s | <1s | <1s |
| 5,000 | +34s1 | +63s1 | +66s1 | +16s1 | +31s1 | +32s1 | <1s | +1s | <1s |
The separation begins after one controller owns a few thousand workloads. At 5,000 applications, HPA p99 is 5.4 times the sharded result and single-KPA p99 is 3.1 times the sharded result. Ten KPA shards remain at the evaluation floor.
¹ The HPA run’s KEDA client and the single-KPA run’s KEDA/KPA clients used qps 200 / burst 400. Every other result used qps 100 / burst 200, including multi-tenant KPA at 5,000.
Cold fan-out
Section titled “Cold fan-out”Cold fan-out makes the queue visible because every autoscaler is created together. Here, color represents absolute latency rather than deviation above a sync floor.
| Applications | Native HPA | Single KPA | 10 KPA shards | ||||||
|---|---|---|---|---|---|---|---|---|---|
| p50 | p95 | p99 | p50 | p95 | p99 | p50 | p95 | p99 | |
| 100 | 17s | 20s | 20s | 2s | 5s | 5s | <1s | 1s | 1s |
| 500 | 34s | 53s | 55s | 19s | 38s | 40s | <1s | 2s | 2s |
| 1,000 | 56s | 103s | 107s | 41s | 88s | 92s | <1s | 7s | 7s |
| 2,500 | 141s | 406s | 452s | 127s | 400s | 447s | 1s | 26s | 27s |
| 5,000 | 129s1 | 394s1 | 443s1 | 112s1 | 378s1 | 427s1 | 1s | 5s | 25s |
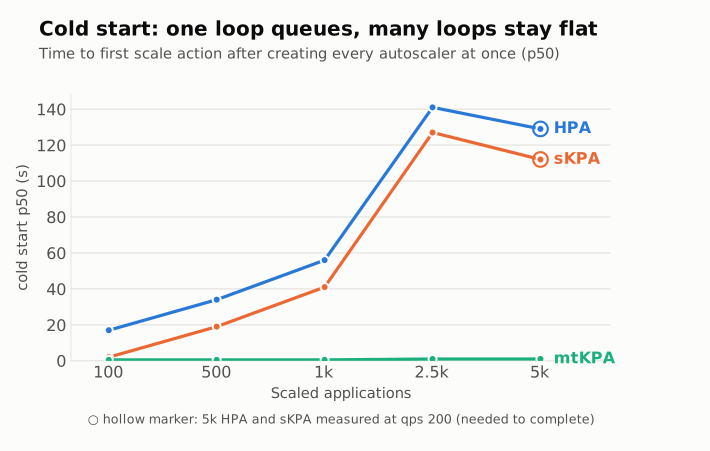
Diagram description
Published cold p50 latency by workload count.
At 5,000 applications, the sharded layout reduced p99 cold latency by 94% relative to HPA. Its median stayed at about one second across the full range, while both single-controller layouts crossed 100 seconds.
¹ The HPA and single-KPA layouts did not complete at qps 100 in the 5,000-object test. Those cells use qps 200 / burst 400 for their configurable KEDA/KPA clients. Every other result uses qps 100 / burst 200, including multi-tenant KPA at 5,000.
Why one control loop stops keeping up
Section titled “Why one control loop stops keeping up”A large cold fan-out gives one controller an initial queue thousands of objects deep. Meanwhile, objects that already exist continue to enqueue periodic reconciliation work. As the population grows, that steady-state work consumes more of the same worker pool and Kubernetes client request budget that is trying to drain the creation backlog.
The incomplete runs show the boundary in this environment:
| Single-controller configuration | 5,000-object outcome |
|---|---|
| qps 100 / burst 200 | HPA and single KPA plateaued near 2,950 created autoscalers |
| qps 150 | Single KPA plateaued near 4,300 |
| qps 200 / burst 400 | HPA and single KPA completed |
| qps 300 | etcd began dropping raft proposals and the run failed |
More workers did not remove the qps ceiling. Raising maxConcurrentReconciles from 5 to 20 improved the initial creation rate, but the run converged on the same qps-100 plateau.
These thresholds belong to this AKS control plane. They are useful because they show the failure shape, not because qps 200 is correct for every cluster. The API server and etcd are still shared across all shards, so validate aggregate request and write load when adding controllers.
Tune the request rate before judging the controller
Section titled “Tune the request rate before judging the controller”The KPA controller has its own Kubernetes client-side qps and burst limiter. In this A/B test, the KEDA operator stayed at qps 100 / burst 200 while only the KPA controller changed:
| Applications | KPA qps 20 p50 | KPA qps 100 p50 | Reduction |
|---|---|---|---|
| 1,000 | 47s | 9s | 81% |
| 2,500 | 118s | 23s | 81% |
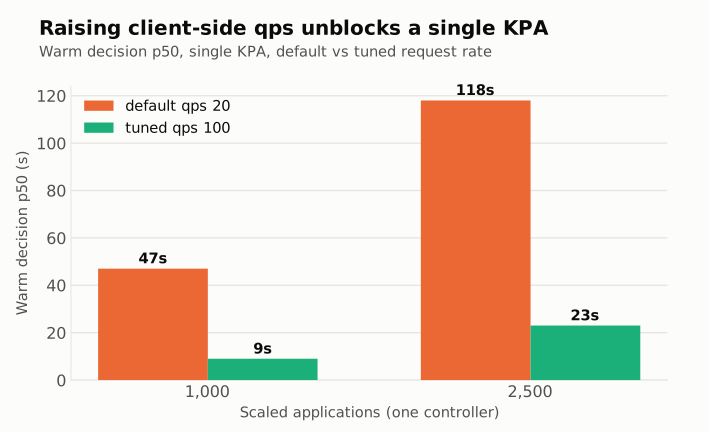
Diagram description
Raising KPA qps from 20 to 100 reduced warm p50 from 47 to 9 seconds at 1000 apps and from 118 to 23 seconds at 2500 apps.
Use the knobs according to ownership:
- Tune the KEDA operator client rate for
ScaledObjectreconciliation, autoscaler creation, and metric-serving work. - Tune the KPA controller client rate for the number of workloads that KPA instance evaluates.
- The native HPA controller is part of the Kubernetes control plane. Managed providers often do not expose its concurrency, sync period, or client settings; tuning KEDA does not tune that controller.
- For multi-tenant KPA, set a per-shard object budget and add shards as the population grows. The benchmark kept ten shards at qps 100 across 100 to 5,000 applications; it did not test the product defaults across that full range.
Do not increase qps in isolation. Watch API-server throttling, etcd latency and proposal failures, controller work-queue depth, reconcile duration, and metric-backend latency while running a production-shaped load test.
Why KPA also shortens the external-metric path
Section titled “Why KPA also shortens the external-metric path”KEDA-generated HPA reads external metrics through the aggregated external.metrics.k8s.io API. KPA reads them directly from its paired KEDA operator over gRPC, removing the shared metrics API server from that decision path.
The benchmark did not isolate that hop as a separate experiment, so the latency ratios above should be attributed to the complete layouts, especially their controller ownership and queueing behavior.
How this was measured
Section titled “How this was measured”- Platform: dedicated AKS cluster, Kubernetes 1.34, Standard paid-tier control plane.
- Worker capacity: 48
Standard_D2ds_v5andStandard_D2s_v5nodes, 2 vCPU / 8 GiB and 250 Pods per node. Controllers and the metric backend ran on a separate three-to-six-node pool. - Population: 100, 500, 1,000, 2,500, and 5,000 generated
ScaledObjects; the largest test created up to roughly 10,000 lightweight Pods.
A representative ScaledObject from the reported metrics-api cohort:
apiVersion: keda.sh/v1alpha1kind: ScaledObjectmetadata: name: target-00001 namespace: tenant-3 annotations: autoscaling.kedify.io/class: kpa # "hpa" selects the native-HPA layoutspec: scaleTargetRef: apiVersion: apps/v1 kind: Deployment name: target-00001 pollingInterval: 30 minReplicaCount: 1 maxReplicaCount: 2 advanced: horizontalPodAutoscalerConfig: behavior: # no stabilization, so warm latency scaleUp: { stabilizationWindowSeconds: 0 } # reflects the ~15s scaleDown: { stabilizationWindowSeconds: 0 } # sync interval, nothing else triggers: - type: metrics-api metadata: url: http://metric-backend.<control-namespace>.svc:8080/metric format: json valueLocation: output targetValue: "1"- Topology: ten tenants and two namespaces per tenant in the multi-tenant layout.
- Timing: 15-second HPA/KPA sync period and 30-second KEDA polling interval.
- Request rates: qps 100 / burst 200 for the configurable KEDA/KPA clients, except qps 200 / burst 400 in the HPA and single-KPA layouts at 5,000. The separate KPA A/B used KPA qps 20 versus 100 while holding KEDA at 100.
- Evidence: every reported point is one completed run that passed the harness’s automated gates for missing objects and timestamps, replica mismatches, pending benchmark Pods, metric-backend errors, restarts, and saturation.
- Precision: Kubernetes timestamps are second-granular.
<1smeans creation and scale action landed in the same timestamp second.
Each population-and-layout cell is one run in one environment, not a confidence interval. Use these measurements to choose what to test in your cluster: client request limits first, then controller ownership, then shared control-plane capacity.
Continue with this topic
Section titled “Continue with this topic”Configure and verify: Configure Kedify for high availability.
Diagnose: Workload does not scale, or scales too slowly.
Related capabilities: Multi-tenant KEDA and KPA · Plan component resource capacity.