
Multi-tenant scaling
Multi-tenant KEDA runs isolated KEDA operators inside one Kubernetes cluster. Each operator owns a non-overlapping set of workload namespaces, with separate event processing, certificates, and reconcile loops. Add a Kedify Pod Autoscaler (KPA) beside an operator when the tenant also needs an isolated horizontal autoscaling control loop.
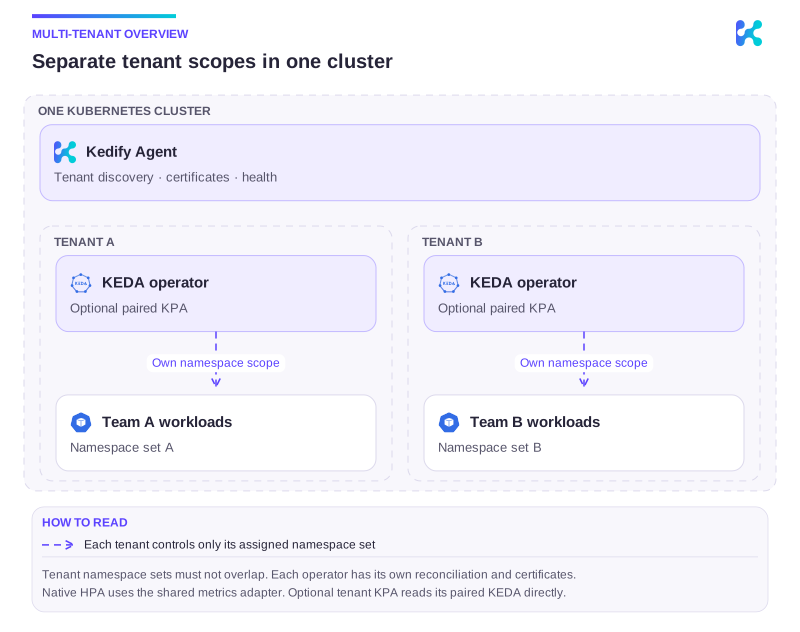
Diagram description
One Kubernetes cluster contains a shared Kedify Agent and isolated tenant KEDA operators. Each tenant owns a distinct set of workload namespaces and may pair its KEDA operator with an optional KPA. Native HPA and its external-metrics adapter remain shared.
Components and responsibilities
Section titled “Components and responsibilities”- Tenant KEDA operators watch only their assigned namespaces. Each operator has its own Deployment, ServiceAccount, TLS certificates, and reconcile loop.
- Shared metrics adapter handles Kubernetes external-metrics requests for native HPA and routes each request to the KEDA operator that owns the workload namespace.
- Kedify Agent discovers tenant registrations, synchronizes certificates, reports health, and enables the Dashboard topology.
- Optional tenant KPA controllers watch the same namespaces as their paired KEDA operator. KPA reads external metrics directly from KEDA over mTLS and uses
metrics.k8s.iofor CPU and memory.
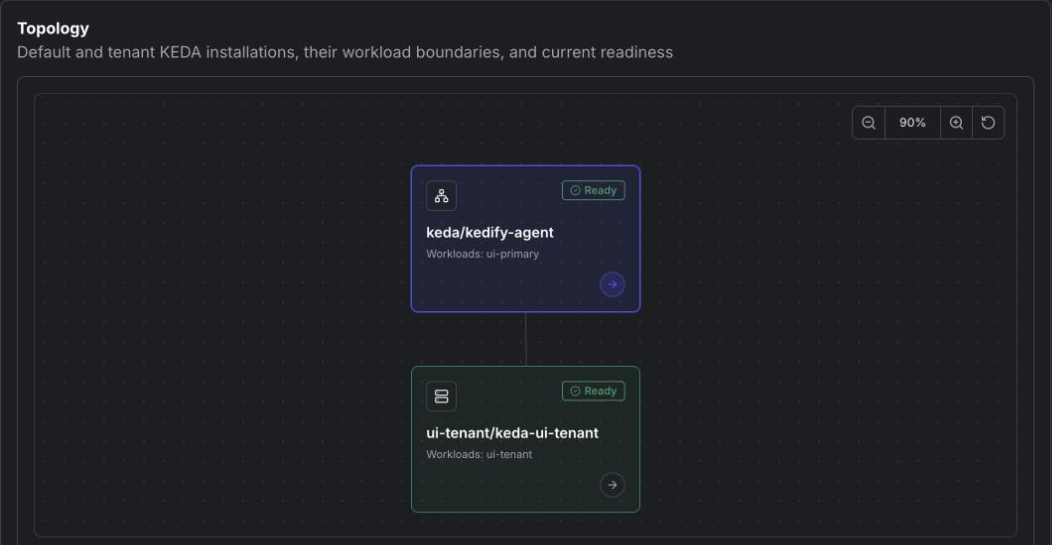
The Multi-Tenant tab in the Kedify Dashboard shows the default installation and its tenant KEDA/KPA pairs. It surfaces namespace ownership, readiness, TLS and routing health, KPA pairing, versions, resource use, and controller logs.
Choose HPA or KPA per workload
Section titled “Choose HPA or KPA per workload”Multi-tenant KEDA and KPA solve related but distinct isolation problems:
| Workload path | Scaling signal path | 1 ↔ N controller |
|---|---|---|
| Native HPA | Shared metrics adapter routes external-metric requests to the tenant KEDA operator | Cluster-wide Kubernetes HPA controller |
| KPA | Tenant KPA queries its paired KEDA operator directly over mTLS | Tenant KPA controller |
Both paths keep KEDA responsible for scaler polling, activation, fallback, cooldown, and scale to zero. KPA changes only the 1 ↔ N path for selected ScaledObjects and preserves the ScaledObject configuration model.
See Kedify Pod Autoscaler for supported metric sources, per-ScaledObject class selection, evaluation intervals, and current limitations.
Deployment modes
Section titled “Deployment modes”The KEDA chart exposes three modes through kedify.multitenant.mode:
| Mode | KEDA operator | Metrics adapter | Webhooks | CRDs |
|---|---|---|---|---|
"" | Standard single-tenant | Standard | Standard | Standard |
"default" | Default tenant with multi-tenant routing | Shared, routes to tenants | Yes | Yes |
"tenant" | Tenant operator only | No | No | No |
The default installation owns cluster-wide singletons and provides the fallback metrics route. Each tenant installation adds only an operator. Unique release names keep Deployments, ServiceAccounts, Services, and certificate Secrets distinct even when several tenants share one control-plane namespace.
Namespace ownership and pairing
Section titled “Namespace ownership and pairing”Every tenant KEDA operator registers its identity, watched namespaces, MetricsService address, TLS Secret, and default-tenant status. The Agent turns these registrations into the metrics adapter’s routing configuration.
Namespace sets must not overlap. When KPA is enabled, its watch set must exactly match its paired KEDA operator. A single KEDA operator paired with several KPA controllers is not a supported tenant topology.
Each KPA-enabled KEDA release also declares the exact KPA Deployment name. The Agent records that Deployment’s Kubernetes UID and verifies ownership before it exposes KPA telemetry or logs.
Routing and isolation
Section titled “Routing and isolation”For native HPA requests, the shared metrics adapter uses a direct namespace-to-tenant lookup. An unmatched namespace uses the default tenant; without a default tenant, the request fails.
For KPA-backed ScaledObjects, the tenant KPA controller bypasses the shared external-metrics API path and queries its paired KEDA MetricsService directly. Tenant-specific mTLS identities protect both routes. Certificate updates are synchronized automatically and reloaded without restarting the metrics adapter.
Operations and scaling
Section titled “Operations and scaling”Sharding bounds the number of ScaledObjects handled by each operator and horizontal autoscaler. You can run several KEDA/KPA pairs in one control-plane namespace, place each pair in a separate namespace, or combine the two patterns.
Monitor routing with the kedify_metrics_adapter_tenant_* metrics and the KedifyTenantConnectionReady and KedifyTenantConnectionNotReady Kubernetes events. For deployment commands and status checks, continue with Install and Configure Multi-tenant Scaling. For capacity planning, see Autoscaler performance and tuning.
Continue with this topic
Section titled “Continue with this topic”Diagnose: Diagnose multi-cluster and tenant controllers.
Related capabilities: Access, telemetry and connectivity boundaries.