HTTP Scaler Metrics Architecture
This document explains how HTTP traffic metrics are collected, aggregated, and used for scaling decisions in Kedify.
Overview
Section titled “Overview”Kedify uses a distributed metrics collection system where:
- kedify-proxy (Envoy) handles traffic and collects metrics
- Interceptor aggregates metrics and pushes them to the scaler via gRPC bridge
- Scaler receives metrics and reports to KEDA
- KEDA makes scaling decisions based on metrics
Architecture Diagram
Section titled “Architecture Diagram”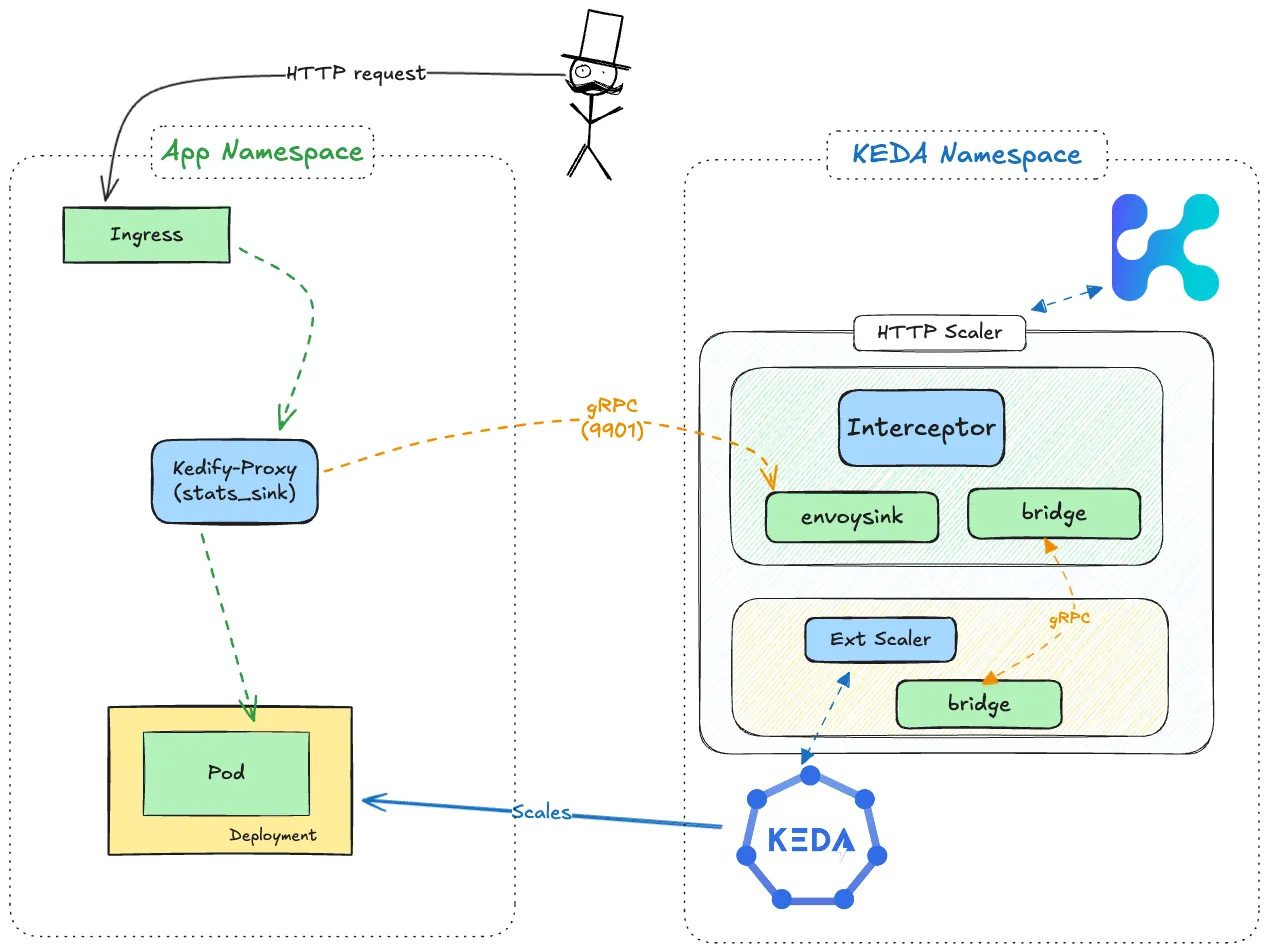 )
)
Components
Section titled “Components”1. kedify-proxy (Envoy)
Section titled “1. kedify-proxy (Envoy)”The kedify-proxy is an Envoy-based proxy that:
- Routes HTTP traffic to backend services
- Collects traffic metrics (RPS, Concurrency)
- Pushes metrics to the interceptor via gRPC
Envoy Configuration:
stats_flush_interval: 1sstats_sinks: - name: kedify_metrics_sink typed_config: '@type': type.googleapis.com/envoy.config.metrics.v3.MetricsServiceConfig transport_api_version: V3 report_counters_as_deltas: true grpc_service: envoy_grpc: cluster_name: kedify_metrics_service2. Interceptor - envoysink (Port 9901)
Section titled “2. Interceptor - envoysink (Port 9901)”The interceptor runs a gRPC server on port 9901 that receives metrics from kedify-proxy. This server is exposed trough a kubernetes service pointing to port 9901 on the interceptor.
Key Components:
MetricsServiceServer: Implements Envoy’s MetricsService gRPC interfaceexternalQueues: In-memory storage for metrics received from Envoy- Cluster-to-HSO mapping: Maps Envoy cluster names to HTTPScaledObjects
Service: keda-add-ons-http-interceptor-kedify-proxy-metric-sink
ports: - name: proxy port: 9901 targetPort: 9901 - name: control-plane port: 5678 targetPort: 56783. gRPC Bridge (Interceptor → Scaler)
Section titled “3. gRPC Bridge (Interceptor → Scaler)”The interceptor pushes metrics to the scaler via a gRPC bridge (enabled by default). This is a streaming connection where the interceptor periodically sends metric batches.
How It Works:
- Interceptor acts as gRPC client, connects to scaler
- Scaler acts as gRPC server, receives metric streams
- Metrics are pushed periodically
Note: The
/queueREST endpoint still exists for debugging. See Debugging section.
4. Scaler
Section titled “4. Scaler”The scaler:
- Receives metrics from interceptors via gRPC bridge (see above)
- Implements KEDA’s External Scaler gRPC interface
- Aggregates metrics across all interceptors when KEDA queries
5. KEDA and HPA
Section titled “5. KEDA and HPA”KEDA uses the scaler’s metrics to:
- Determine if workload should be active (scale from zero)
- Calculate desired replica count
- Update the HorizontalPodAutoscaler (HPA)
Metrics
Section titled “Metrics”RPS (Requests Per Second)
Section titled “RPS (Requests Per Second)”- Source:
cluster.upstream_rq_totalfrom Envoy - Use case:
scalingMetric: requestRate
Concurrency
Section titled “Concurrency”- Source:
cluster.upstream_rq_activefrom Envoy - Use case:
scalingMetric: concurrency
Metric Keys
Section titled “Metric Keys”Metrics are keyed by namespace/httpscaledobject-name. This means:
- All traffic matching an HTTPScaledObject is aggregated together
- Different paths, hosts, or query parameters within the same HSO share metrics
Debugging
Section titled “Debugging”Query Current Metrics
Section titled “Query Current Metrics”kubectl get --raw /api/v1/namespaces/keda/services/keda-add-ons-http-interceptor-admin:9090/proxy/queueQuery Envoy-to-HSO Mapping
Section titled “Query Envoy-to-HSO Mapping”kubectl get --raw /api/v1/namespaces/keda/services/keda-add-ons-http-interceptor-admin:9090/proxy/envoy-metrics-mapInference Traffic Specifics
Section titled “Inference Traffic Specifics”For inference workloads using inferencePool:
- Traffic flows through port 9002 on kedify-proxy
- External Processing (ext_proc) filter integrates with Endpoint Picker
- Metrics are collected the same way as regular traffic
- Key format remains
namespace/httpscaledobject-name
See HTTP Scaler for Inference for more details.